| Index | Recent Threads | Unanswered Threads | Who's Active | Guidelines | Search |
| World Community Grid Forums
|
| No member browsing this thread |
|
Thread Status: Active Total posts in this thread: 5561
|
|
| Author |
|
|
Former Member
Cruncher Joined: May 22, 2018 Post Count: 0 Status: Offline |
Come on Sek you know the NASA GISS, from the granddaddy of Global Warming James Hansen, has an appropriate amount of fiddle factor applied to it to make fit the CO2 Hypothesis Don't make me have to demonstrate why this is the case 0.71C again for Feb. Whatever anyone else says, at GISS, for you and me baby the only way is up. False Claims Proven False http://tamino.wordpress.com/2010/02/25/false-claims-proven-false/#comment-40536 As for the claim that the introduction of adjustments to temperature records has created false warming, here’s a comparison between the northern-hemisphere result using raw GHCN data, to the results using only northern-hemisphere meteorological stations from NASA GISS:  Once again the denialists’ claims are proven false. The adjustments used by NASA GISS have reduced rather than increased recent warming. Unlike some who claim to have analyzed these data, I combined station records in a proper way, I computed temperature anomalies properly, and I’ve computed area-weighted averages. All these steps are essential for a correct result. The claim that the station dropout is responsible for any, let alone most, of the modern warming trend, is utterly, demonstrably, provably false. The claim that adjustments introduced by analysis centers such as NASA GISS have introduced false warming is utterly, demonstrably, provably false. [Edit 1 times, last edit by Former Member at Mar 15, 2010 5:34:34 PM] |
||
|
|
Former Member
Cruncher Joined: May 22, 2018 Post Count: 0 Status: Offline |
Climate emails inquiry: Energy consultant linked to physics body's submission Evidence from Institute of Physics drawn from energy industry consultant who argues global warming is a religion http://www.guardian.co.uk/environment/2010/ma...ute-of-physics-submission |
||
|

|
Sekerob
Ace Cruncher Joined: Jul 24, 2005 Post Count: 20043 Status: Offline |
One does not see it often, but for the first 59 days of 2010 the global temperatures summed to being in near equilibrium, for north and south hemisphere, this time NOAA/NCDC who updated their data set... hence, the near all purple of that 2010 bar, the southern hemisphere just a smidgen warmer... what to expect with those predominant ocean covered half that is so glowingly warm in that top layer (see previous post with SST map by the world renowned British MET (think the Royal Dutch Meteorological Institute (KNMI) has it very up close to that too).
---------------------------------------- Not many more years left on the warmer side there, DA, or are there when looking at the purple bars and that black trace line? Any more grand-daddies to slander, in usual complete absence of even the vaguest credible support... sourcing watts, mcintyre, monckton, ball, booker, inhofe, morano, heartland institute, iop, sppi? You promised and you had enough time to unchill. Daily Departure - March 15, 2010 (Day 74)  How is it going to look next week, but more importantly, the April-Oct period? Why is that snow so rapidly disappearing in North America after their incredible pile... heat from somewhere, but where, when the sun is still near cycle low? Will there be enough melt-water for summer irrigation? The farmers in the Rockies region did not get too good news in the last few days from the agricultural forecast department. Last years it was the sun, time and again putting this TSI curve against the HADCRUT3v chart, this year El Niño, next year the Wagga Wagga variable... they now are heading imminently for 37C and they're on meteorological autumn. Some global cooling... lest James H. has that thermometer in his ear too.
WCG
Please help to make the Forums an enjoyable experience for All! |
||
|
|
Sekerob
Ace Cruncher Joined: Jul 24, 2005 Post Count: 20043 Status: Offline |
It's hard to believe it's nearly 2 years when the lowest point was reached since 2005. Oddly, the ONI and SOI and ENSO charts firmly put the finger on several robust La Nina events since... so if there is an El Niño this time, DA, being the cause of the 2010 warming, could it have been...?
----------------------------------------Odd news Me thinketh, therefore I ammeth! edit: some spellchecking edit2: correct special character mangle.
WCG
----------------------------------------Please help to make the Forums an enjoyable experience for All! [Edit 3 times, last edit by Sekerob at Mar 17, 2010 7:26:55 AM] |
||
|
|
Former Member
Cruncher Joined: May 22, 2018 Post Count: 0 Status: Offline |
Not many more years left on the warmer side there, DA, or are there when looking at the purple bars and that black trace line? Any more grand-daddies to slander, in usual complete absence of even the vaguest credible support... sourcing watts, mcintyre, monckton, ball, booker, inhofe, morano, heartland institute, iop, sppi? i.e. grasping at straws |
||
|
|
Former Member
Cruncher Joined: May 22, 2018 Post Count: 0 Status: Offline |
Eso this is not a matter of opinion this is a matter of science Ask Copernicus if the Sun was the centre of the Solar System and he would have said yes. But what was the consensus of the day? So 97% of climate scientists are wrong (and/or part of the conspiracy) but you, Dave Autumns who is not an expert of (nor has any background in) climate science, is right? Oh the hubris. [Edit 2 times, last edit by Former Member at Mar 16, 2010 8:29:57 PM] |
||
|
|
Sekerob
Ace Cruncher Joined: Jul 24, 2005 Post Count: 20043 Status: Offline |
hmmm, wonder what good old Galilee met in consensus from the honorables... witches floating, witches drowning... is science not treated the same way today by some as it was then? fortunately the Inconvenient Truth will prevail, only today with the extensive global data interchange the largest majority can no longer be fooled into contorted view of the minority hiding behind their JY extreme 2010 edition. Those not wearing them can see things such as the British MET February 2010 Sea Surface Temperatures for 71% of the Earths cover:
----------------------------------------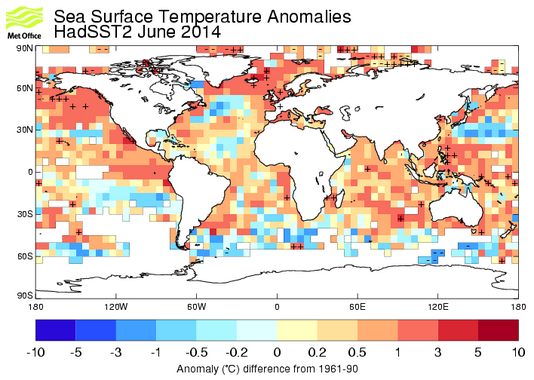 And the just released NOAA/NCDC February data, that produce the red curve in chart below, which shows a very very close alignment with the Hadley SST curve, with different base line, their update not expected until next week [and it does not take a rocket scientists to tell how that will NOT change the ugly outlook]:  Vertical bars indicating the 1 standard deviation range. Uncanny not, how NOAA and Hadley match... same temps sources maybe... scientific consensus maybe ... just another El Niño after a couple of La Nina's so conveniently missed by the Aint True-ists, maybe? It's looking hot, from my comfy chair, no not the one of the KWSN, so hot, it's a 2 month record breaker for the ocean part of our modern era climate with present orientations and elevations of the continents. edit: % sign
WCG
----------------------------------------Please help to make the Forums an enjoyable experience for All! [Edit 2 times, last edit by Sekerob at Mar 17, 2010 7:31:06 AM] |
||
|
|
Sekerob
Ace Cruncher Joined: Jul 24, 2005 Post Count: 20043 Status: Offline |
In looking on following various melt indicators I wondered if it was possible to know for those not seeing the snow what down to earth signs would be there... the satellites observing, for yesterday displaying that North American snow is rapidly disappearing (all that red):
----------------------------------------Daily Departure - March 16, 2010 (Day 75)  Sure enough there is a track called Red River where snow-melt run-off translates in acute water levels rise, the sign of sings and it over the decades moving earlier and earlier... no DA & co, not straight line, in leaps and bounds. Here the picture what happened there:  As it is, this one local climatologists a boder of draught for the SW of the USA later in the year. Also I mentioned the Rockies and the outlook for farmers to have less melt water available for irrigation of the lands this coming NH growth season. Here a link to an article in USA Today's climate section: Water shortages may hit northern Rockies March 11 it appeared... just when that Red River started rising. "There's not much time to make it up," said hydrologist Phil Morrisey of the Natural Resource Conservation Service in Idaho. "Even an abundant snowfall in March would be unlikely to make much of a difference this late in the season." It's True I say and 75% agree [that's called consensus based on unhindered availability of information that cannot be shouted out by the Moncktonists] PS: Here's latest Dr. Roy Spencer's AMSU temp readings for the past 13 years [what would a climate post be without a temp chart. 2010 looks to be cooking where that little square left upper half... just 1.05 warmer than last year:  The good Dr. [his name printed bottom of above chart] had the epiphany that not the big city UHI's cause temp reading distortions [or USHI]... no, it's those rural weather stations... yes, he dismisses his own Sat readings... the left hand not knowing what the right hand was writing in yesterdays bulletin. It must be the weather not cooperating with the wishful thinking.
WCG
Please help to make the Forums an enjoyable experience for All! |
||
|
|
Former Member
Cruncher Joined: May 22, 2018 Post Count: 0 Status: Offline |
Well its a fact the Earth is warming and cooling -- http://wattsupwiththat.com/2010/03/16/rewriting-the-decline/
|
||
|
|
Sekerob
Ace Cruncher Joined: Jul 24, 2005 Post Count: 20043 Status: Offline |
dear marysduby, Watts is coinventer of the JY special protective glasses. He's been debunked so often that most visitors there are the buyers of those... and he's making money with every hit to his site, yours too. See the adds?
----------------------------------------Here's how he fools you... the old Global / Local switch he does so often. Top global, Bottom, regional. The MCA/MWP was, mostly Europe:  As for the top of the chart, don't be surprised to find that it is not a as was presented in the IPCC AR4 report. It's worth a read, without the JY glasses of course.
WCG
Please help to make the Forums an enjoyable experience for All! |
||
|
|
|