| Index | Recent Threads | Unanswered Threads | Who's Active | Guidelines | Search |
| World Community Grid Forums
|
| No member browsing this thread |
|
Thread Status: Active Total posts in this thread: 5561
|
|
| Author |
|
|
Former Member
Cruncher Joined: May 22, 2018 Post Count: 0 Status: Offline |
Wow, really liked the pictures, not the creative story around it... never a word on massive volcano eruptions for instance and the rest. Let me take a copy for posterity
---------------------------------------- Has a reasonable resemblance to other published chart such as GISTEMP and the HadCRU version: 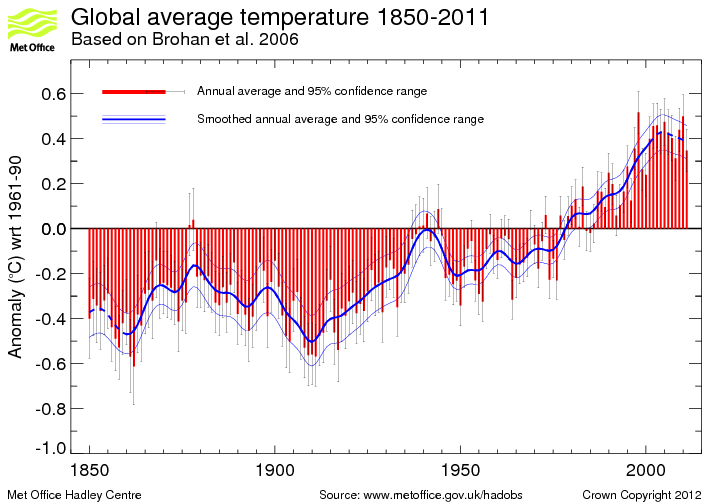 Don't know if David Autumns will thank you as you've just co-debunked his statement that there was no warming in the 21st century, which started in 2000. It's been a little bit more than 0.32C on a longer baseline at that. Might we call this and Own Goal? As for when the cooling phase starts... plz let us know when that will be... next Terrible winter? Strangely, polar melt and snow has not been informed of this change... here's the seasonal one for North America, minus Greenland:  Can you see the spring and summer trend, whilst autumn is flatter than Kansas. maybe one of these famous ever shifting oscillations. Have a great day GeraldRube. --//-- P.S. Just wonder why they picked 2002 as turning point. The chart seemingly drawn on GISTEMP data, which shows: 2000 0.34 2001 0.33 2002 0.64 2003 0.51 2004 0.62 2005 0.59 2006 0.56 2007 0.74 2008 0.28 2009 0.49 2010 0.69 And 2011, well it's an La Nina year, so far, and a second one building... who knows you'll be needing your Wellingtons in Texas... for sure, the presence shows that we're still warming, regardless. [Edit 1 times, last edit by Former Member at Aug 13, 2011 2:28:10 PM] |
||
|
|
Former Member
Cruncher Joined: May 22, 2018 Post Count: 0 Status: Offline |
Sorry, GeraldRube, I gave the wrong shortlist... they did not look right with 2007 showing higher when we know that 2010 is hottest on record. Those above are the [meteorological] winter season (Dec-Jan-Feb). Here are the annuals as used in that FR chart:
2000 0.329 2001 0.473 2002 0.563 2003 0.553 2004 0.475 2005 0.625 2006 0.549 2007 0.580 2008 0.438 2009 0.573 2010 0,631 From mid 2010, the year turned La Nina Just tell me when you feel to have been lied to, or more diplomatic, liberal with the truth and by whom. you can do the fact checking on the Medieval Warming Period, nowadays also referred to as Medieval Warming Optimum... a quick check on 2 paleo reconstruction papers I happened to have seen before suggest more taken liberties on the ''globality'' of the MWO The current temperature is probably less than the medieval peak Here a summary of debunk: http://www.realclimate.org/wiki/index.php?tit...al_Warm_Period_was_warmer Food for thought, and not by all. ciao --//-- P.S. Why can't you do your own fact checking first... it would show you had ''questioned'' the validity of what you like to ''believe''. |
||
|
|
Former Member
Cruncher Joined: May 22, 2018 Post Count: 0 Status: Offline |
So, dear GeraldRube, global cooling started in 2002, David Autumns praying for more sunspots to come around for a normal winter IHBY. Think you've been sweating your panties off lately, La Nina rebuilding so more heat can be pushed below for later release in a next El Nino. It happens that GISTEMP just released the July figures. Here's global for that month since 2000
2000 0,33 2001 0,51 2002 0,56 2003 0,49 2004 0,19 2005 0,55 2006 0,42 2007 0,55 2008 0,52 2009 0,66 2010 0,51 2011 0,60 Here a summary of the average temps for this month where the USA citizens were advised to get used to warmer summers: 2000-2011: 0,49 2002-2010: 0.49 2002-2005: 0.44 2006-2011: 0.57 I know what I think of this and of the Free Republic and the likes, and it''s food for yours, if you can be enticed to! --//-- |
||
|
|
David Autumns
Ace Cruncher UK Joined: Nov 16, 2004 Post Count: 11062 Status: Offline Project Badges: 


|
Sek you can keep your GISTEMP
----------------------------------------They really are pulled out of a hat  |
||
|
|
David Autumns
Ace Cruncher UK Joined: Nov 16, 2004 Post Count: 11062 Status: Offline Project Badges:
|
---------------------------------------- |
||
|
|
Former Member
Cruncher Joined: May 22, 2018 Post Count: 0 Status: Offline |
A webpage by the National Public Radio, and if you ask me, there's real ID in there.
http://www.npr.org/2011/08/15/139261223/the-arctics-diminishing-sea-ice Note the near surface air temperatures... in the melt season they'll hover around arctic freezing point [salt water]. The favved DMI polar temp chart in the denilosphere: http://ocean.dmi.dk/arctic/meant80n.uk.php Physics dictates this, but come autumn/winter/spring time that right line is the canaries distress tone. The older one get, the more difficult it become to hear the high pitches. Horatio Algeranon posted another of his poems on climate and weather, this one on Joe Bastardi, the latest "TV" weather man [in same lineage as A.Watts] peddling it has not warmed in the 21st Century... the willful audience is devouring it like cupcakes, every day of the year. “Say it ain’t so, Joe please, say it ain’t so That’s not what I wanna hear Joe Ain’t I got a right to know Say it ain’t so, Joe please, say it ain’t so I’m sure they telling us lies Joe, Please tell us it ain’t so. … (Ooo Babies) Don’t you think we’re gonna get burned? ” – Murry Salby – “Say It Ain’t So Joe” (Ok, it’s actually “Murray Head” who wrote it) --//-- P.S. An ice chart by another ice tracker [UNI Bremen], who're said not to have sensory problems: http://www.iup.uni-bremen.de:8084/amsr/ice_ext_n.png http://www.iup.uni-bremen.de:8084/amsr/arctic_AMSRE_nic.png JAXA come up with the highly natural change for the day of 40,000. In some worlds it's called ''fill in the blanks". In the real and alternate universe, the Arctic poles will freeze up again, but till then http://www.iup.uni-bremen.de:8084/amsr/arctic_AMSRE_nic.png Things are way below normal, sunspots or no sunspots. |
||
|
|
David Autumns
Ace Cruncher UK Joined: Nov 16, 2004 Post Count: 11062 Status: Offline Project Badges:
|
Yet another nail in the coffin of UK PLC
----------------------------------------http://www.greenwisebusiness.co.uk/news/95-pe...et-crc-deadline-2531.aspx The CRC, which launched last year, requires large public and private sector organisations to buy allowances to cover emissions produced from their usage of electricity and heat. Under the CRC timetable, organisation had to submit reports about their carbon emissions by July 29. .... and who will the large public and private sector organisations required to buy allowances to cover emissions produced from their usage of electricity and heat pass this additional and unecessary cost on to? |
||
|
|
Former Member
Cruncher Joined: May 22, 2018 Post Count: 0 Status: Offline |
No warming in the 21st Century? Was that liberal, very liberal, or outright?
Monday, August 15, 2011 It's So Hot . . . The US Alone had in 2011, so far: 4,250 new heat records The US Alone had in August 2011, so far: 425 new heat records The US Alone had on August 14, 2011: 6 Heat Records It's so hot, the Dallas weather radio transmitter is fried: PUBLIC INFORMATION STATEMENT NATIONAL WEATHER SERVICE FORT WORTH TX 435 PM CDT MON AUG 15 2011 ..DALLAS NOAA ALL HAZARDS RADIO IS TRANSMITTING ON LOW POWER THE DALLAS NOAA ALL HAZARDS RADIO TRANSMITTER...WHICH BROADCASTS ON A FREQUENCY OF 162.400 MHZ...CALL SIGN KEC 56...REMAINS UNRELIABLE DUE TO A TRANSMITTER COOLING PROBLEM THROUGH TUESDAY...AUGUST 16TH. THE TRANSMITTER IS BROADCASTING ON LOW POWER...BUT AT TIMES THE TRANSMITTER MAY QUIT BROADCASTING ALL TOGETHER. WE APOLOGIZE FOR THIS INCONVENIENCE. Seems the southern US states will have bumper harvest... of dust me thinketh. --//-- P.S. The Temperature Record as used in GeraldRube's FreeRepublic linked article:  At some point in time it became lying with statistics, the butler will have done it, and I know who the butlers are. Such as, there's this guy called Richard Lindzen who's peddling fantastic, non physics supported miracle escape science such as his Infrared Iris function, later dubbed The Lindzen Iris. It seems this gentlemen of the Aint True lobby also has an extensive history in the Smoking Aint Damaging your Health lobby. Does that build confidence in his ''scientific'' credence? Miracles occur, and if not, there's always our escape clause:  Anyone wants to take bets with 7 billion of us, by 2060 an estimated 9+billion? |
||
|
|
David Autumns
Ace Cruncher UK Joined: Nov 16, 2004 Post Count: 11062 Status: Offline Project Badges:
|
Hurrah they finally got around to me
----------------------------------------Price rise alert: npower announced today that it will be increasing its prices by an average of 15.7% for gas and 7.2% for electricity from 1st October 2011. This increase will add an extra £133 on to the average annual standard dual fuel bill, which will increase from £1,149 to £1,282 as a result. Here’s a round up of energy price rises and announcements to date: ScottishPower raised its prices by 17.4% or £124 for gas and 9.9% or £56 for electricity on 1st August 2011. British Gas prices will increase prices 17.9% for gas or £120 and 15.7% for electricity or £69 on 18th August 2011. E.ON will be increasing its prices by an average of 18.1% or £114 for gas and 11.4% or £56 for electricity from 13th September 2011. SSE will be increasing its prices by an average of 18.8% or £122 for gas and 11.8% or £52 for electricity from 14th September 2011. See title of thread Dave |
||
|
|
David Autumns
Ace Cruncher UK Joined: Nov 16, 2004 Post Count: 11062 Status: Offline Project Badges:
|
Just to put Sek's record temps in perspective
----------------------------------------http://www.smh.com.au/environment/weather/fre...-1iuv2.html#ixzz1VANJIP9T |
||
|
|
|