| Index | Recent Threads | Unanswered Threads | Who's Active | Guidelines | Search |
| World Community Grid Forums
|
| No member browsing this thread |
|
Thread Status: Active Total posts in this thread: 38
|
|
| Author |
|
|
Former Member
Cruncher Joined: May 22, 2018 Post Count: 0 Status: Offline |
I was always interested in the progress of the computing power World Community Grid can use. And while the numbers are available on the "Global Statistics History" page, humans are not especially gifted in processing raw numbers. So I made a chart from these numbers some time ago and updated it periodically. As others might also be interested in this, I thought of sharing it here:
*klick here to enlarge* 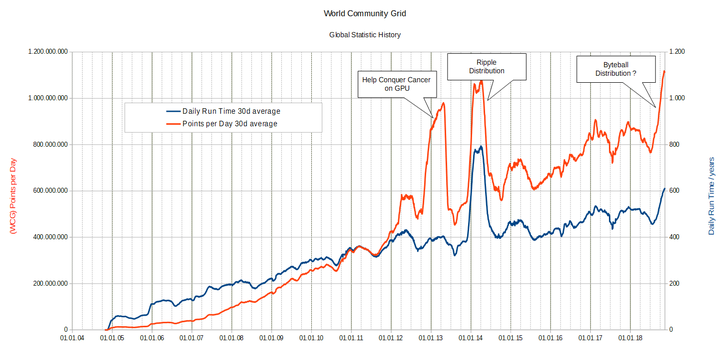 I used a 30-day-average, as the daily numbers fluctuate a lot and the chart looked not especially useful this way. I also added some explanations at noteworthy developments. If anybody has some questions about the chart or some suggestions how to improve it, please do! If there is an interest in this chart, I will update it every few months, so everybody can track the progress. |
||
|
|
Former Member
Cruncher Joined: May 22, 2018 Post Count: 0 Status: Offline |
Very neat, Sheridon
 |
||
|
|
DCS1955
Veteran Cruncher USA Joined: May 24, 2016 Post Count: 668 Status: Offline Project Badges: 


|
Wow GPU capability has a major impact. What is ripple distribution? Is it some sort of BOINC process? If so why have they stopped using it?
----------------------------------------  |
||
|
|
Aurum
Master Cruncher The Great Basin Joined: Dec 24, 2017 Post Count: 2391 Status: Offline Project Badges: 


|
Sheridon, Love the graph!!!
----------------------------------------Now if I could just find my byteballs...   ...KRI please cancel all shadow-banning ...KRI please cancel all shadow-banning |
||
|
|
Former Member
Cruncher Joined: May 22, 2018 Post Count: 0 Status: Offline |
As promised, here is an update of the Global Statistics Graph as of Dec 31, 2018. I plan to update this every 3 months, as long as there is somebody interested in it.
----------------------------------------*click here to enlarge*  Output of WCG continued to increase noticably during Q4 2018, most likely because of distribution of cryptocurrencies linked to WCG like Byteball and to a lesser extent Bible Pay. However, as Byteball lowered their distribution by 90% starting Dec 24, this trend could reverse. The last week of the year output did not rise anymore, although it shows no clear decline for now. I hope most Byteball contributors stay with WCG, although crunching is not profitable anymore. If not, their impact will only be a short spike like that of the Ripple distribution in 2014. Keep on all volunteers, let's increase WCG's output in 2019! Additionally to the graph above, I made another one, that shows run time only, but also how it distributed among projects over time: *click here to enlarge*  Outsmart Ebola Together ended during Q4 2018, freeing resources for the other projects. All but Fight AIDS@home 2 and Help Stop TB got their share of it. While Fight AIDS@home 2 continues slow but steady with around 30 years runtime per day, Help Stop TB makes a short brake since beginning of December, due to a problem with creation of workunits (barely visible in the graph due to the small size of the project). Mapping Cancer Markers remains the largest project, eating up nearly half of WCG's resources. With 462,000 years of run time until now, it even surpasses Fight AIDS@home, which ended in 2016 after more than 10 years on WCG. [Edit 1 times, last edit by Former Member at Jan 1, 2019 10:05:01 AM] |
||
|
|
Seoulpowergrid
Veteran Cruncher Joined: Apr 12, 2013 Post Count: 823 Status: Offline Project Badges:


|
I for one really enjoy charts and graphs like these as they help me to get a clearer picture of what is going on. Thanks much for putting your work into creating these!
---------------------------------------- |
||
|
|
Eugene Zenzen
Veteran Cruncher USA Joined: Mar 31, 2006 Post Count: 890 Status: Offline Project Badges: 


|
Yes, these charts are fascinating, thanks so much for creating them and sharing. I'm also curious about the "Ripple Distribution" - what is that?
---------------------------------------- |
||
|
|
Former Member
Cruncher Joined: May 22, 2018 Post Count: 0 Status: Offline |
Ripple is a crypto currency, and for some amount of time this was distributed dependent on how many points you made on WCG. Obviously this attracted some people to WCG for financial reasons, and once the distrubution stopped, these people left.
|
||
|
|
Macromancer
Veteran Cruncher United States Joined: Sep 6, 2016 Post Count: 994 Status: Offline Project Badges:


|
awesome charts. thanks for sharing.
|
||
|
|
BladeD
Ace Cruncher USA Joined: Nov 17, 2004 Post Count: 28976 Status: Offline Project Badges:


|
awesome charts. thanks for sharing. Yep!!!  |
||
|


|
|