| Index | Recent Threads | Unanswered Threads | Who's Active | Guidelines | Search |
| World Community Grid Forums
|
| No member browsing this thread |
|
Thread Status: Active Total posts in this thread: 17
|
|
| Author |
|
|
Former Member
Cruncher Joined: May 22, 2018 Post Count: 0 Status: Offline |
Latest Global Temperatures at the Global Warming website of Roy Spencer Ph. D.
----------------------------------------Evidence for Natural Climate Cycles in the IPCC Climate Models’ 20th Century Temperature Reconstructions January 27th, 2010 by Roy W. Spencer, Ph. D. What can we learn from the IPCC climate models based upon their ability to reconstruct the global average surface temperature variations during the 20th Century? While the title of this article suggests I’ve found evidence of natural climate cycles in the IPCC models, it’s actually the temperature variability the models CANNOT explain that ends up being related to known climate cycles. After an empirical adjustment for that unexplained temperature variability, it is shown that the models are producing too much global warming since 1970, the period of most rapid growth in atmospheric carbon dioxide. This suggests that the models are too sensitive, in which case they are forecasting too much future warming, too. Climate Models’ 20th Century Runs We begin with the IPCC’s best estimate of observed global average surface temperature variations over the 20th Century, from the “HadCRUT3″ dataset. (Monthly running 3-year averages are shown throughout.) Of course, there are some serious concerns over the validity of this observed temperature record, especially over the strength of the long-term warming trend, but for the time being let’s assume it is correct (click on image to see a large version). read more and then go to the second page Is Spencer Hiding the Increase? We Report, You Decide One of the great things about the internet is people can post anything they want, no matter how stupid, and lots of people who are incapable of critical thought will simply accept it. I’m getting emails from people who have read blog postings accusing me of “hiding the increase” in global temperatures when I posted our most recent (Dec. 2009) global temperature update. In addition to the usual monthly temperature anomalies on the graph, for many months I have also been plotting a smoothed version, with a running 13 month average. The purpose of such smoothing is to better reveal longer-term variations, which is how “global warming” is manifested. But on the latest update, I switched from 13 months to a running 25 month average instead. It is this last change which has led to accusations that I am hiding the increase in global temperatures. Well, here’s a plot with both running averages in addition to the monthly data. I’ll let you decide whether I have been hiding anything:. 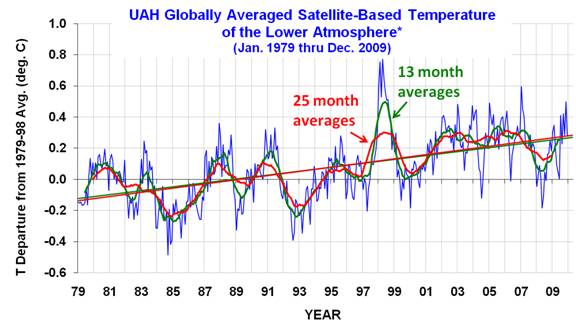 Note how the new 25-month smoother minimizes the warm 1998 temperature spike, which is the main reason why I switched to the longer averaging time. If anything, this ‘hides the decline’ since 1998…something I feared I would be accused of for sure after I posted the December update. But just the opposite has happened, with accusations I have hidden the increase. Go figure. [Edit 1 times, last edit by Former Member at Jan 31, 2010 1:26:49 AM] |
||
|
|
Former Member
Cruncher Joined: May 22, 2018 Post Count: 0 Status: Offline |
http://climatedebatedaily.com/
----------------------------------------A new way to understand disputes about Global warning Calls to action Dissenting voices [Edit 1 times, last edit by Former Member at Jan 31, 2010 4:31:08 AM] |
||
|
|
Former Member
Cruncher Joined: May 22, 2018 Post Count: 0 Status: Offline |
Global Warming
The current cycle of global warming is changing the rhythms of climate that all living things have come to rely upon. What will we do to slow this warming? How will we cope with the changes we've already set into motion? While we struggle to figure it all out, the face of the Earth as we know it—coasts, forests, farms, and snowcapped mountains—hangs in the balance. |
||
|
|
Former Member
Cruncher Joined: May 22, 2018 Post Count: 0 Status: Offline |
The Case of the Missing Carbon
Alone in a sealed jar, a mouse would die from exhaled CO2. But as scientist Joseph Priestley observed in 1771, adding a mint plant allows the mouse to thrive. In this proof of photosynthesis, the mint absorbed CO2, retained carbon for growth, and released oxygen. Two centuries later humans tried—and failed—to survive in a sealed environment in Arizona's Biosphere 2.  By Tim Appenzeller Republished from the pages of National Geographic magazine It's there on a monitor: the forest is breathing. Late summer sunlight filters through a canopy of green as Steven Wofsy unlocks a shed in a Massachusetts woodland and enters a room stuffed with equipment and tangled with wires and hoses. The machinery monitors the vital functions of a small section of Harvard Forest in the center of the state. Bright red numbers dance on a gauge, flickering up and down several times a second. The reading reveals the carbon dioxide concentration just above the treetops near the shed, where instruments on a hundred-foot (30-meter) tower of steel lattice sniff the air. The numbers are running surprisingly low for the beginning of the 21st century: around 360 parts per million, ten less than the global average. That's the trees' doing. Basking in the sunshine, they inhale carbon dioxide and turn it into leaves and wood. In nourishing itself, this patch of pine, oak, and maple is also undoing a tiny bit of a great global change driven by humanity. Start the car, turn on a light, adjust the thermostat, or do just about anything, and you add carbon dioxide to the atmosphere. If you're an average resident of the United States, your contribution adds up to more than 5.5 tons (5 metric tons) of carbon a year. The coal, oil, and natural gas that drive the industrial world's economy all contain carbon inhaled by plants hundreds of millions of years ago—carbon that now is returning to the atmosphere through smokestacks and exhaust pipes, joining emissions from forest burned to clear land in poorer countries. Carbon dioxide is foremost in an array of gases from human activity that increase the atmosphere's ability to trap heat. (Methane from cattle, rice fields, and landfills, and the chlorofluorocarbons in some refrigerators and air conditioners are others.) Few scientists doubt that this greenhouse warming of the atmosphere is already taking hold. Melting glaciers, earlier springs, and a steady rise in global average temperature are just some of its harbingers. By rights it should be worse. Each year humanity dumps roughly 8.8 billion tons (8 metric tons) of carbon into the atmosphere, 6.5 billion tons (5.9 metric tons) from fossil fuels and 1.5 billion (1.4 metric) from deforestation. But less than half that total, 3.2 billion tons (2.9 metric tons), remains in the atmosphere to warm the planet. Where is the missing carbon? "It's a really major mystery, if you think about it," says Wofsy, an atmospheric scientist at Harvard University. His research site in the Harvard Forest is apparently not the only place where nature is breathing deep and helping save us from ourselves. Forests, grasslands, and the waters of the oceans must be acting as carbon sinks. They steal back roughly half of the carbon dioxide we emit, slowing its buildup in the atmosphere and delaying the effects on climate. Who can complain? No one, for now. But the problem is that scientists can't be sure that this blessing will last, or whether, as the globe continues to warm, it might even change to a curse if forests and other ecosystems change from carbon sinks to sources, releasing more carbon into the atmosphere than they absorb. The doubts have sent researchers into forests and rangelands, out to the tundra and to sea, to track down and understand the missing carbon. 23456789Next » |
||
|
|
Sekerob
Ace Cruncher Joined: Jul 24, 2005 Post Count: 20043 Status: Offline |
Re the OP, here's from the same Dr. Roy Spencer: http://discover.itsc.uah.edu/amsutemps/execute.csh?amsutemps+002 ... the same doctor that chooses a never seen before, and no single natural cycle matching frequency to create his make-believe. It's the hottest January on record from this preliminary reading, GLOBAL TERMS... select the 20 year high-low averages to see for yourself, near real time.
----------------------------------------
WCG
Please help to make the Forums an enjoyable experience for All! |
||
|
|
Former Member
Cruncher Joined: May 22, 2018 Post Count: 0 Status: Offline |
2009: Second Warmest Year on Record; End of Warmest Decade
2009 was tied for the second warmest year in the modern record, a new NASA analysis of global surface temperature shows. The analysis, conducted by the Goddard Institute for Space Studies (GISS) in New York City, also shows that in the Southern Hemisphere, 2009 was the warmest year since modern records began in 1880........ Climatologist Gavin Schmidt Discusses the Surface Temperature Record ... |
||
|
|
Former Member
Cruncher Joined: May 22, 2018 Post Count: 0 Status: Offline |
Psst .. some seem don´t read well and post the same
----------------------------------------[Edit 1 times, last edit by Former Member at Feb 3, 2010 1:43:48 AM] |
||
|
|
Former Member
Cruncher Joined: May 22, 2018 Post Count: 0 Status: Offline |
Psst .. some seem don´t read well and post the same Not sure if that's a nod to me... I originally posted "the hottest decade" news on 1/7 in the Greenies part II thread (aka not sure how much longer they will be able to keep crunching in the UK). Need to repeat again and again for it to ever sink in for some. |
||
|
|
Former Member
Cruncher Joined: May 22, 2018 Post Count: 0 Status: Offline |
Oky doky
----------------------------------------Nite nite [Edit 1 times, last edit by Former Member at Feb 3, 2010 4:04:21 AM] |
||
|
|
densnaps
Ace Cruncher Sunny Lancaster Windmill capital of England Joined: Apr 27, 2007 Post Count: 4205 Status: Offline Project Badges: 


|
The Case of the Missing Carbon Alone in a sealed jar, a mouse would die from exhaled CO2. But as scientist Joseph Priestley observed in 1771, adding a mint plant allows the mouse to thrive. In this proof of photosynthesis, the mint absorbed CO2, retained carbon for growth, and released oxygen. Two centuries later humans tried—and failed—to survive in a sealed environment in Arizona's Biosphere 2. My garden is a have then I have mint plants all over it |
||
|

|
|