Cisco cpus and memory pools -- update November 11, 2010
Moderators: Developers, Moderators
Cisco cpus and memory pools -- update November 11, 2010
Cisco routers with IOS 12.1 and up have indexed SNMP tables for CPUs and memory pools. I've created the appropriate queries and graphs for these, to allow for tracking the utilization of individual CPUs and memory pools separately.
Memory Usage
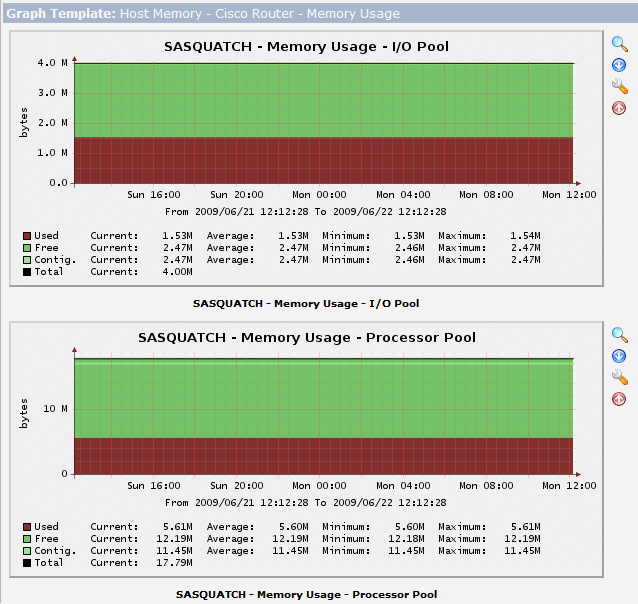
The memory usage chart shows bytes used, bytes free, and byts of maximum contiguous free memory for each of the monitored memory pools. Even small routers have multiple memory pools btw.
Memory data is obtained with a simple SNMP Query, and works the same on Cacti 0.8.6 and 0.8.7.
--> see this page for the memory tarball and instructions <--
CPU Usage
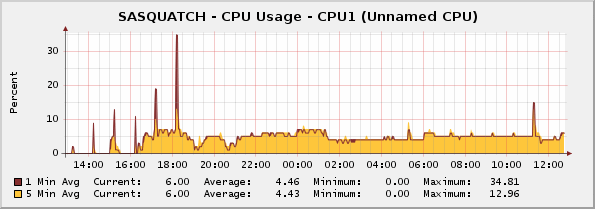
The cpu usage chart shows the 1-min and 5-min average utilization rates (as a percentage) for each managed CPU. Note that small routers only have a single processor and you are not going to benefit over the Cisco CPU template that is bundled with cacti.
The CPU usage data collection uses a script instead of a simple SNMP Query, for a couple of reasons (CPU long names have to be collected, fallback OIDs are tested in some cases, etc). Since Cacti 0.8.6 and 0.8.7 have different API structures for the SNMP function calls, the software is packaged differently for each version.
--> see this page for the CPU tarball and instructions <--
Last edited by ehall on Thu Nov 11, 2010 9:26 pm, edited 16 times in total.
The memory graphs look great. The CPU graphs look like they might be useful but they're not filling up with any data:
RRDTool Command:
/usr/bin/rrdtool graph - \
--imgformat=PNG \
--start=-86400 \
--end=-300 \
--title="router_2r1 - CPU Usage - CPU1.3.6.1.4.1.9.9.109.1.1.1.1.2.1 (onboard CPU)" \
--rigid \
--base=1000 \
--height=120 \
--width=600 \
--alt-autoscale-max \
--lower-limit=0 \
--vertical-label="Percent" \
--slope-mode \
DEF:a="/usr/share/cacti/rra/router_2r1_fivemin_1509.rrd":oneMin:AVERAGE \
DEF:b="/usr/share/cacti/rra/router_2r1_fivemin_1509.rrd":fiveMin:AVERAGE \
CDEF:cdefi=TIME,1137006932,GT,a,a,UN,0,a,IF,IF,TIME,1137006932,GT,b,b,UN,0,b,IF,IF,+ \
AREA:a#FFC73B:"1 Min Avg" \
GPRINTLAST:"Current\:%8.2lf" \
GPRINTAVERAGE:"Average\:%8.2lf" \
GPRINTMAX:"Maximum\:%8.2lf\n" \
AREA:b#EA8F00:"5 Min Avg":STACK \
GPRINTLAST:"Current\:%8.2lf" \
GPRINTAVERAGE:"Average\:%8.2lf" \
GPRINTMAX:"Maximum\:%8.2lf\n" \
LINE1:cdefi#000000:""
RRDTool Says:
OK
Nope, two.ehall wrote:Do you just have one CPU in the device list?
New enough for the script to appear to work but old enough that I had to change the OIDs as per your directions. I'm trying to run it on: MSFC Software (C6MSFC-JSV-M), Version 12.1(8b)E9ehall wrote:Are you running a pretty recent version of IOS?
It's my best guess that you'd like to see:ehall wrote:What does the poller log show (manually running it through php works too)?
01/11/2006 04:55:07 PM - CMDPHP: Poller[0] Host[15] DS[1508] CMD: /usr/bin/php5 -q /usr/share/cacti/scripts/cisco_cpu_usage.php comp_2r1.comp.com, 02r, 1, , , 161, 500 get fiveMin 1.3.6.1.4.1.9.9.109.1.1.1.1.2.3, output: U
01/11/2006 04:55:07 PM - CMDPHP: Poller[0] Host[15] DS[1508] CMD: /usr/bin/php5 -q /usr/share/cacti/scripts/cisco_cpu_usage.php comp_2r1.comp.com, 02r, 1, , , 161, 500 get oneMin 1.3.6.1.4.1.9.9.109.1.1.1.1.2.3, output: U
01/11/2006 04:55:08 PM - CMDPHP: Poller[0] Host[15] DS[1509] CMD: /usr/bin/php5 -q /usr/share/cacti/scripts/cisco_cpu_usage.php comp_2r1.comp.com, 02r, 1, , , 161, 500 get fiveMin 1.3.6.1.4.1.9.9.109.1.1.1.1.2.1, output: U
01/11/2006 04:55:08 PM - CMDPHP: Poller[0] Host[15] DS[1509] CMD: /usr/bin/php5 -q /usr/share/cacti/scripts/cisco_cpu_usage.php comp_2r1.comp.com, 02r, 1, , , 161, 500 get oneMin 1.3.6.1.4.1.9.9.109.1.1.1.1.2.1, output: U
I haven't tried it with PHP 5
It looks like the list of device IDs is getting mangled ("get fiveMin 1.3.6.1.4.1.9.9.109.1.1.1.1.2.3" should be "get fiveMin 1" or similar)
Run the following commands and report back please
That should give clue where it's going off the rails
It looks like the list of device IDs is getting mangled ("get fiveMin 1.3.6.1.4.1.9.9.109.1.1.1.1.2.3" should be "get fiveMin 1" or similar)
Run the following commands and report back please
Code: Select all
/usr/bin/php5 -q /usr/share/cacti/scripts/cisco_cpu_usage.php comp_2r1.comp.com, 02r, 1, , , 161, 500 index
/usr/bin/php5 -q /usr/share/cacti/scripts/cisco_cpu_usage.php comp_2r1.comp.com, 02r, 1, , , 161, 500 query cpuIndex
/usr/bin/php5 -q /usr/share/cacti/scripts/cisco_cpu_usage.php comp_2r1.comp.com, 02r, 1, , , 161, 500 query cpuName
ehall wrote:Run the following commands and report back please
Code: Select all
/usr/bin/php5 -q /usr/share/cacti/scripts/cisco_cpu_usage.php comp_2r1.comp.com, 02r, 1, , , 161, 500 index
1.3.6.1.4.1.9.9.109.1.1.1.1.2.3
Code: Select all
/usr/bin/php5 -q /usr/share/cacti/scripts/cisco_cpu_usage.php comp_2r1.comp.com, 02r, 1, , , 161, 500 query cpuIndex
1.3.6.1.4.1.9.9.109.1.1.1.1.2.3:1.3.6.1.4.1.9.9.109.1.1.1.1.2.3
Code: Select all
/usr/bin/php5 -q /usr/share/cacti/scripts/cisco_cpu_usage.php comp_2r1.comp.com, 02r, 1, , , 161, 500 query cpuName
1.3.6.1.4.1.9.9.109.1.1.1.1.2.3:CPU1.3.6.1.4.1.9.9.109.1.1.1.1.2.3
Well it sure dies earlyknobdy wrote:ehall wrote:Run the following commands and report back please1.3.6.1.4.1.9.9.109.1.1.1.1.2.1Code: Select all
/usr/bin/php5 -q /usr/share/cacti/scripts/cisco_cpu_usage.php comp_2r1.comp.com, 02r, 1, , , 161, 500 index
1.3.6.1.4.1.9.9.109.1.1.1.1.2.3
The script is supposed to cut "1.3.6.1.4.1.9.9.109.1.1.1.1.2." off the full OID for each CPU that is discovered, leaving just the relative OID at the end. That value is then used to qualify all of the other lookups (the processor's description, the load averages for the processor, etc.). All of the other stuff will break if that doesn't happen.
It looks like that is failing, probably because you don't have a leading dot at the beginning of the fully-qualified OID (dunno why not).
Try the version of the script attached here. It does an if/else for leading dots on the full OID.
Last edited by ehall on Wed Feb 01, 2006 4:41 pm, edited 1 time in total.
I'm not sure but my guess is at least IOS 12 and probably 12.1 for reliability (maybe higher for the .7 and .8 CPU utilization OIDs).knobdy wrote:What is the minimum version of IOS for these to work?
The CPU stuff is described in http://www.cisco.com/warp/public/477/SN ... _snmp.html, which refers to IOS "12.0(22)S3"
The memory stuff is described in http://www.cisco.com/warp/public/477/SN ... emory.html, but only makes passing reference to an ancient OID that was obsoleted in IOS 11.1
Thanks, I'll take a look at those - and when I get back into the office tomorrow, spend some more time investigating what versions all of them are and such (I'm dealing with around 15 routers - all at varying IOS levels, models, etc..).
For now, here's the debug for the graph. I just copied the new script over the old one - assuming that and waiting for the next poll to run is all I needed to do:
/usr/bin/rrdtool graph - \
--imgformat=PNG \
--start=-86400 \
--end=-300 \
--title="argus_kc2r1 - CPU Usage - CPU1.3.6.1.4.1.9.9.109.1.1.1.1.2.1 (onboard CPU)" \
--rigid \
--base=1000 \
--height=120 \
--width=600 \
--alt-autoscale-max \
--lower-limit=0 \
--vertical-label="Percent" \
--slope-mode \
DEF:a="/usr/share/cacti/rra/r1_fivemin_1509.rrd":oneMin:AVERAGE \
DEF:b="/usr/share/cacti/rra/r1_fivemin_1509.rrd":fiveMin:AVERAGE \
CDEF:cdefi=TIME,1137035805,GT,a,a,UN,0,a,IF,IF,TIME,1137035805,GT,b,b,UN,0,b,IF,IF,+ \
AREA:a#FFC73B:"1 Min Avg" \
GPRINTLAST:"Current\:%8.2lf" \
GPRINTAVERAGE:"Average\:%8.2lf" \
GPRINTMAX:"Maximum\:%8.2lf\n" \
AREA:b#EA8F00:"5 Min Avg":STACK \
GPRINTLAST:"Current\:%8.2lf" \
GPRINTAVERAGE:"Average\:%8.2lf" \
GPRINTMAX:"Maximum\:%8.2lf\n" \
LINE1:cdefi#000000:""
No, if the patch works, the index values for the CPUs will change so the old queries will not work anymore.
At the least you will need to refresh the index (device manager, choose the right router, then refresh the data query by clicking the "green circle" icon over on the right).
While you are in the device screen, hit the Verbose Query option next to the data source, and post the results please.
If the CPUs show up with index value of 1 and 3, then you'll need to recreate the graphs. You'll probably want to delete the old ones too.
Here's what I got, what's the verdict? Looks like recreating will be required...:ehall wrote:While you are in the device screen, hit the Verbose Query option next to the data source, and post the results please.
If the CPUs show up with index value of 1 and 3, then you'll need to recreate the graphs. You'll probably want to delete the old ones too.
+ Running data query [14].
+ Found type = '4 '[script query].
+ Found data query XML file at '/usr/share/cacti/resource/script_queries/cisco_cpu.xml'
+ XML file parsed ok.
+ Executing script for list of indexes '/usr/bin/php5 -q /usr/share/cacti/scripts/cisco_cpu_usage.php r1.com, 02r, 1, , , 161, 500 index'
+ Executing script query '/usr/bin/php5 -q /usr/share/cacti/scripts/cisco_cpu_usage.php 2r1.com, 02r, 1, , , 161, 500 query cpuIndex'
+ Found item [cpuIndex='1.3.6.1.4.1.9.9.109.1.1.1.1.2.1'] index: 1.3.6.1.4.1.9.9.109.1.1.1.1.2.1
+ Found item [cpuIndex='1.3.6.1.4.1.9.9.109.1.1.1.1.2.3'] index: 1.3.6.1.4.1.9.9.109.1.1.1.1.2.3
+ Executing script query '/usr/bin/php5 -q /usr/share/cacti/scripts/cisco_cpu_usage.php 2r1com, 02r, 1, , , 161, 500 query cpuName'
+ Found item [cpuName='CPU1.3.6.1.4.1.9.9.109.1.1.1.1.2.1'] index: 1.3.6.1.4.1.9.9.109.1.1.1.1.2.1
+ Found item [cpuName='CPU1.3.6.1.4.1.9.9.109.1.1.1.1.2.3'] index: 1.3.6.1.4.1.9.9.109.1.1.1.1.2.3
+ Executing script query '/usr/bin/php5 -q /usr/share/cacti/scripts/cisco_cpu_usage.php 2r1.com, 02r, 1, , , 161, 500 query cpuDesc'
+ Found item [cpuDesc='onboard CPU'] index: 1.3.6.1.4.1.9.9.109.1.1.1.1.2.1
+ Found item [cpuDesc='onboard CPU'] index: 1.3.6.1.4.1.9.9.109.1.1.1.1.2.3
+ Found data query XML file at '/usr/share/cacti/resource/script_queries/cisco_cpu.xml'
{Update}
Still nothing showing up in the graphs. I removed the query from the device and then deleted the graphs and the data sources. I then recreated all of them and waited for the next poll - nada. This is what I get, beyond the above, running debug on the graph. I'm wondering if it should read "CPU1.3..." or "CPU 1.3..."?
RRDTool Command:
/usr/bin/rrdtool graph - \
--imgformat=PNG \
--start=-86400 \
--end=-300 \
--title="2r1 - CPU Usage - CPU1.3.6.1.4.1.9.9.109.1.1.1.1.2.1 (onboard CPU)" \
--rigid \
--base=1000 \
--height=120 \
--width=600 \
--alt-autoscale-max \
--lower-limit=0 \
--vertical-label="Percent" \
--slope-mode \
DEF:a="/usr/share/cacti/rra/2r1_fivemin_1558.rrd":oneMin:AVERAGE \
DEF:b="/usr/share/cacti/rra/2r1_fivemin_1558.rrd":fiveMin:AVERAGE \
CDEF:cdefi=TIME,1137077458,GT,a,a,UN,0,a,IF,IF,TIME,1137077458,GT,b,b,UN,0,b,IF,IF,+ \
AREA:a#FFC73B:"1 Min Avg" \
GPRINTLAST:"Current\:%8.2lf" \
GPRINTAVERAGE:"Average\:%8.2lf" \
GPRINTMAX:"Maximum\:%8.2lf\n" \
AREA:b#EA8F00:"5 Min Avg":STACK \
GPRINTLAST:"Current\:%8.2lf" \
GPRINTAVERAGE:"Average\:%8.2lf" \
GPRINTMAX:"Maximum\:%8.2lf\n" \
LINE1:cdefi#000000:""
RRDTool Says:
OK
Also of note, I have two routers (might be the same issue on others only providing two of the three graphs) which do not display graph options on the graph creation page. Here is the verbose query:
+ Running data query [15].
+ Found type = '3' [snmp query].
+ Found data query XML file at '/usr/share/cacti/resource/snmp_queries/cisco_memory.xml'
+ XML file parsed ok.
+ Executing SNMP walk for list of indexes @ '.1.3.6.1.4.1.9.9.48.1.1.1.2'
+ Located input field 'poolName' [walk]
+ Executing SNMP walk for data @ '.1.3.6.1.4.1.9.9.48.1.1.1.2'
+ Found item [poolName='No more variables left in this MIB View (It is past the end of the MIB tree)'] index: 2 [from value]
+ Located input field 'poolValid' [walk]
+ Executing SNMP walk for data @ '.1.3.6.1.4.1.9.9.48.1.1.1.4'
+ Found item [poolValid='No more variables left in this MIB View (It is past the end of the MIB tree)'] index: 4 [from value]
+ Found data query XML file at '/usr/share/cacti/resource/snmp_queries/cisco_memory.xml'
This particular router is running Version 12.2(6e). This router, IOS version and image are all supposed to support this OID/MIB....
Still broken. That needs to say "cpuIndex='1'" and "cpuIndex='3'"knobdy wrote:Here's what I got, what's the verdict?
+ Executing script query '/usr/bin/php5 -q /usr/share/cacti/scripts/cisco_cpu_usage.php 2r1.com, 02r, 1, , , 161, 500 query cpuIndex'
+ Found item [cpuIndex='1.3.6.1.4.1.9.9.109.1.1.1.1.2.1'] index: 1.3.6.1.4.1.9.9.109.1.1.1.1.2.1
+ Found item [cpuIndex='1.3.6.1.4.1.9.9.109.1.1.1.1.2.3'] index: 1.3.6.1.4.1.9.9.109.1.1.1.1.2.3
I'll do a more-complicated pattern matching routine and post another update.
I wish this were perl, regexp makes this crap easy.
Who is online
Users browsing this forum: No registered users and 0 guests