Multi CPU Utilization Graph
Moderators: Developers, Moderators
Re: Multi CPU Utilization Graph
tbh, I gave up with that graph because in truth, it was messy once you got over four CPU's. I now graph my CPUs using the standard templates as there is also a CPUTotal with that now.
Cacti Developer & Release Manager
The Cacti Group
Director
BV IT Solutions Ltd
+--------------------------------------------------------------------------+
Cacti Resources:
Cacti Website (including releases)
Cacti Issues
Cacti Development Releases
Cacti Development Documentation
The Cacti Group
Director
BV IT Solutions Ltd
+--------------------------------------------------------------------------+
Cacti Resources:
Cacti Website (including releases)
Cacti Issues
Cacti Development Releases
Cacti Development Documentation
Re: Multi CPU Utilization Graph
I agree. Its much easier to automate if you got plenty of machines. And building reports. The cons are you are blind for each core, lets say a process gets crazy and eat 100% of one core. But i think we can live with that.netniV wrote: Tue Feb 25, 2020 6:49 pm tbh, I gave up with that graph because in truth, it was messy once you got over four CPU's. I now graph my CPUs using the standard templates as there is also a CPUTotal with that now.
Open for other solutions, for me i would love to use automate for this
Re: Multi CPU Utilization Graph
It there a maybe working template working with cacti version 1.2.16 for multi-core CPU, that provide display independently CPU core load on one graph ?
Re: Multi CPU Utilization Graph
Hi all,
yesterday I tried the 32 CPU template published in this post but I had the same issue reported above about datasource mapping after the creation of the Graph.
I tried to find the error in the template but I preferred to make a new template on my version of Cacti (1.2.15), so you can see below the result:
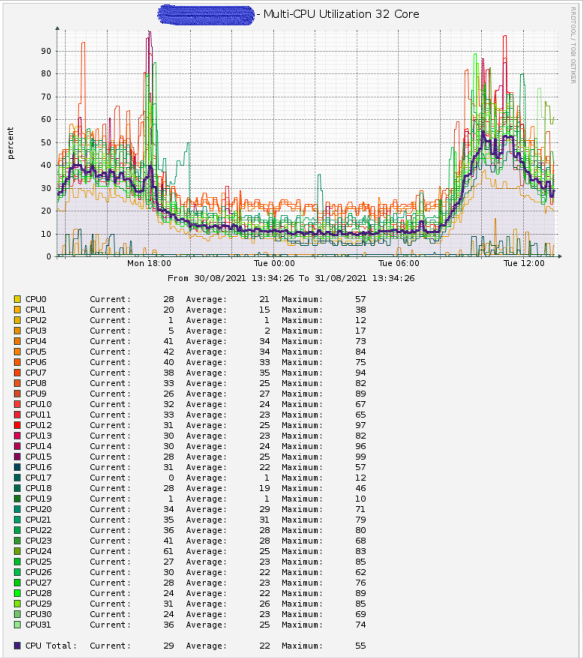
The template works as the previous published on this post so first you need to create the graph for each CPU via "Host MIB CPU Utilization" and then you can create the Multi-CPU graph using the Datasource of the single CPUs.
Only one thing for the Cacti Devolpers, I see a problem in selecting the datasource on the graph when a theme other than the classic is applied, I can't see all the DS available, I don't know if it has already been fixed in the new versions, just to mark it.
Regards.
yesterday I tried the 32 CPU template published in this post but I had the same issue reported above about datasource mapping after the creation of the Graph.
I tried to find the error in the template but I preferred to make a new template on my version of Cacti (1.2.15), so you can see below the result:
The template works as the previous published on this post so first you need to create the graph for each CPU via "Host MIB CPU Utilization" and then you can create the Multi-CPU graph using the Datasource of the single CPUs.
Only one thing for the Cacti Devolpers, I see a problem in selecting the datasource on the graph when a theme other than the classic is applied, I can't see all the DS available, I don't know if it has already been fixed in the new versions, just to mark it.
Regards.
- Attachments
-
- cacti_graph_template_host_mib_-_multi-cpu_32_core.rar
- (8.63 KiB) Downloaded 256 times
Re: Multi CPU Utilization Graph
cacti 1.2.29
all templates from this topic are not working. An unclear error occurs when trying to create a graph.

all templates from this topic are not working. An unclear error occurs when trying to create a graph.
Who is online
Users browsing this forum: No registered users and 22 guests