Preface
This tutorial to help you figuring out, how to extend cacti's build-in capabilities by own scripts and queries. Some of them are of course part of the standard cacti distribution files. By those means, it is possible not only to work on SNMP related data but to retrieve virtually everything using custom-made code. This is not even restricted to certain programming languages; you'll find php, perl, shell/batch and more.
There a two ways extending cacti's build-in capabilities:
- Data Input Methods for querying single readings or multiple, but non-indexed readings
- Data Queries for indexed readings (like Network Interfaces or other SNMP Tables, you may even create Data Queries as scripts)
As always: Use this information at your own risk.
Common Tasks
In principle, it is possible to divide the following tasks into three different parts:
- how to retrieve data
- how to store data
- how to present data

Data Input Method
Find more about this topic in the cacti documentation: Chapter 9. Data Input Methods
Create a Data Input method to tell cacti how to gather data
Data Input Method returning a single value
Lets start with a simple script, that takes a hostname or IP address as input parameter, returning a single value. You may find this one as <path_cacti>/scripts/ping.pl:
Code: Select all
#!/usr/bin/perl
$ping = `ping -c 1 $ARGV[0] | grep icmp_seq`;
$ping =~ m/(.*time=)(.*) (ms|usec)/;
print $2;
Please fill in Name, select Script/Command as Input Type and provide the command that should be used to retrieve the data. You may use <path_cacti> as a symbolical name for the path_to_your_cacti_installation. Those commands will be executed from crontab; so pay attention to providing full path to binaries if required (e.g. /usr/bin/perl instead of perl). Enter all Input Parameters in <> brackets. Click
create to see:
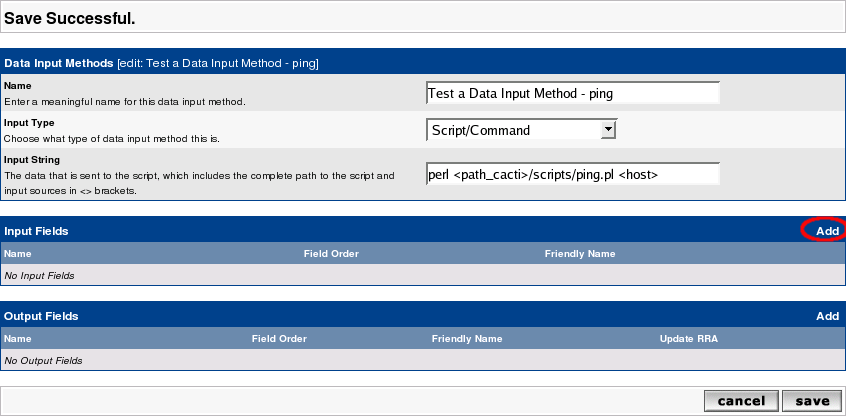
Now lets define the Input Fields. Click Add as given above to see:

The DropDown Field [Input] contains one single value only. This is taken from the Input String <host> above. Fill Friendly Name to serve your needs. The Special Type Code allows you to provide parameters from the current Device to be queried. In this case, the hostname will be taken from the current device.
Click create to see:
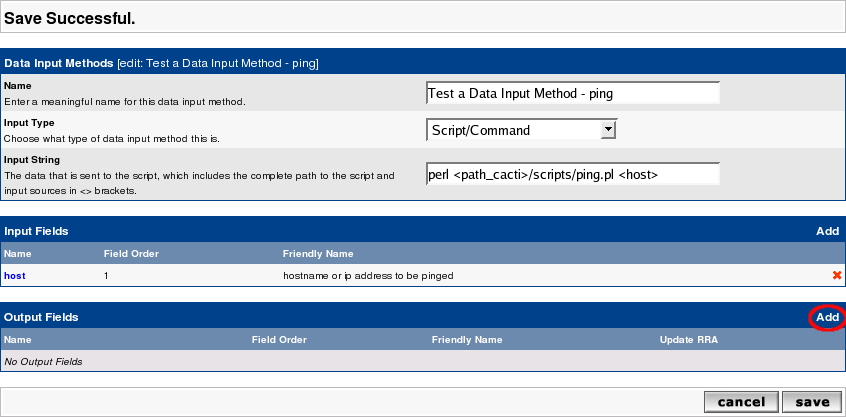
At least, define the Output Fields. Again, click Add as described above:

Provide a short Field [Output] name and a more meaningful Friendly Name. As you will want to save those data, select Update RRD File. Create to see:

Click Save and you're done.
Create a Data Template to tell cacti how to store data
Now you want to tell cacti, how to store the data retrieved from this script. Please go to Data Templates and click Add. You should see:

Fill in the Data Templates Name with a reasonable text. This name will be used to find this Template among others. Then, please fill in the Data Source Name. This
is the name given to the host-specific Data Source. The variable |host_description| is taken from the actual Device. This is to distinguish data sources for different devices. The Data Input Method is a DropDown containing all known scripts and the like. Select the Data Input Method you just created. The Associated RRA's is filled by default. At the moment there's no need to change this. The lower part of the screen looks like:

The Internal Data Source Name may be defined at your wish. There's no need to use the same name as the Output Field of the Data Input Method, but it may look nicer.
Click create to see:

Notice the new DropDown Output Field. As there is only one Output Field defined by our Data Input Method, you'll see only this. Here's how to connect the Data
Source Name (used in the rrd file) to the Output Field of the Script. Click Save and you're done.
Create a Graph Template to tell cacti how to present the data
Now you want to tell cacti, how to present the data retrieved from this script. Please go to Graph Templates and click Add. You should see:
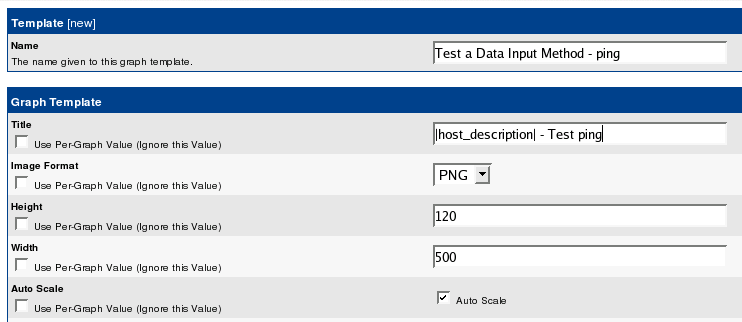
Fill in Name and Title. The variable |host_description| will again be filled from the Device's definition when generating the Graph. Keep the rest as is and Create. See:

Now click Add to select the first item to be shown on the Graphs:

Select the correct Data Source from the DropDown, fill in a color of your liking and select AREA as a Graph Item Type. You want to fill in a Text Format that will be shown underneath the Graph as a legend. Again, Create:

Notice, that not only an entry was made under Graph Template Items, but under Graph Item Inputs as well. Don't bother with that now. Lets fill some more nice legends, see:
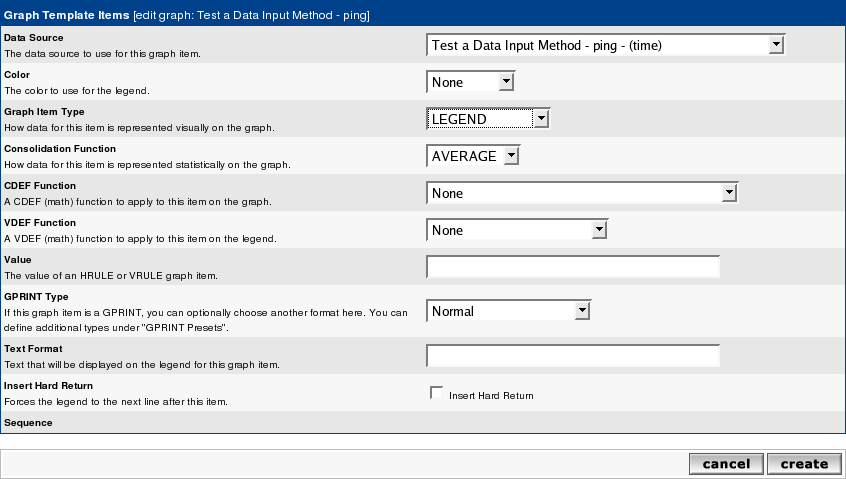
Notice, that the Data Source is filled in automagically. Select LEGEND as Graph Item Type (it is not really a Graph Item Type in rrdtool-speak, but a nice time-saver), and click Create to see:

Wow! Three items filled with one action! You may want to define a Vertical Label at the very bottom of the screen and Save.
Apply the Graph Template to your Device
Now go to the Devices and select the one of your choice. See the Associated Graph Templates in the middle of this page:

Select your newly created Graph template from the Add Graph Template DropDown. Click Add to see:

The Template is added and shown as Not Being Graphed. On the top of the page you'll find the Create Graphs for this Host link. Click this to see:

Check the box that belongs to the new template and Create. See the results:

This will automatically
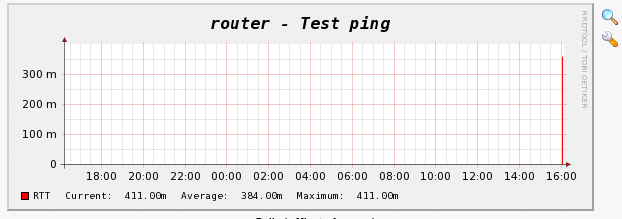
- create the needed Graph Description from the Graph Template. As you may notice from the success message, this Graph takes the hosts name in it: router - Test ping (router is the hosts name of this example).
- create the needed Data Sources Description from the Data Template. Again, you will find the Hosts name replaced for |host_description|
- create the needed rrd file with definitions from the Data Template. The name of this file is derived from the Host and the Data Template in conjunction with an auto-incrementing number.
- create an entry to the poller_table to instruct cacti to gather data on each polling cycle
Data Query
What is a Data Query? Here's the text from cacti's website (Chapter 10. Data Queries):
Data queries are not a replacement for data input methods in Cacti. Instead they provide an easy way to query, or list data based upon an index, making the data easier to graph. The most common use of a data query within Cacti is to retrieve a list of network interfaces via SNMP. .... While listing network interfaces is a common use for data queries, they also have other uses such as listing partitions, processors, or even cards in a router.
One requirement for any data query in Cacti, is that it has some unique value that defines each row in the list. This concept follows that of a 'primary key' in SQL, and makes sure that each row in the list can be uniquely referenced. Examples of these index values are 'ifIndex' for SNMP network interfaces or the device name
for partitions.
There are two types of data queries that you will see referred to throughout Cacti. They are script queries and SNMP queries. Script and SNMP queries are virtually identical in their functionality and only differ in how they obtain their information. A
script query will call an external command or script and an SNMP query will make an SNMP call to retrieve a list of data.
SNMP-Type Data Queries (SNMP Queries)All data queries have two parts, the XML file and the definition within Cacti. An XML file must be created for each query, that defines where each piece of information is and how to retrieve it. This could be thought of as the actual query. The second part is
a definition within Cacti, which tells Cacti where to find the XML file and associates the data query with one or more graph templates.
For SNMP Queries, you won't need to create a data retrieval script. Cacti will use SNMP to retrieve information. But cacti will need additional information on how the indexed data is structured. Think about a table (a MIB table in this case); you'll have to tell cacti about the table structure. This is done by defining an XML file (see: SNMP Query XML Syntax for all details). Basically, you have to define the index to tell cacti about the number of rows and about their unique index. This index is later used to access each rows data. Furthermore, you may define columns, that serve as descriptive fields to be shown in the selection table. The XML file knows them as
Code: Select all
<direction>input</direction>Code: Select all
<direction>output</direction>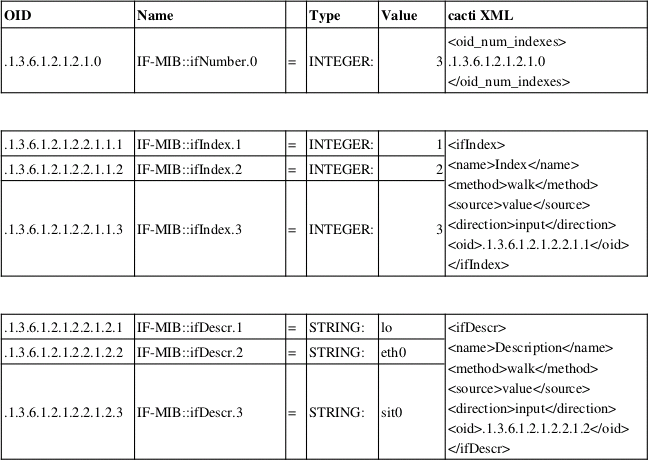


and see the corresponding table structure when defining New Graphs for that device (my laptop):

Now you can map
- Index: IF-MIB::ifIndex
- Status: IF-MIB::ifOperStatus
- Description: IF-MIB::ifDescr
- Type: IF-MIB::ifType
- Speed: IF-MIB::ifSpeed
To sum up: the SNMP XML file is somehow a replacement for the Data Input Method described above to be used on indexed values. It tells cacti, what data it should retrieve (direction: output). To help you identifying the relevant indexes, the XML defines descriptive parameters (direction: input) to be displayed in the selection table.
A walkthrough for this is given now. It is based on the already supplied interfaces.xml XML file.
Create a Data Query to tell cacti how to retrieve data
Go to Data Queries and click Add to see:

Here, we are using the already existing interface.xml file. Select Get SNMP Data (Indexed) as Data Input Method. Create to see:

See, that cacti found the XML file. Don't bother with the Associated Graph Templates at the moment. The success message does not include checking of the XML file's content. Not lets proceed to the next definitions.
Create a Data Template to tell cacti how to store data
This is the exact copy of the definitions made above. So I do not repeat everything here. Data Input Method must be selected as Get SNMP Data (Indexed). As this data source is a COUNTER type, select this as the Data Source Type. But after saving the new Data Source definition, you may want to define a second Data Source to the same Data Template. To do so, select New from the Data Source Item heading to see:

The name of the Data Source (ifOutOctets) is not replaced in the Tab until you save your work. By default, Maximum Value is set to 100. This is way too low for an interface. All readings above this value will be stored as NaN by rrdtool. To avoid this, set to 0 (no clipping) or to a reasonable value (e.g. interface speed). Don't forget to specify COUNTER! You will have noticed, that the name of the data source does not match the Name in the interface.xml. Don't worry, the solution to this is given later on.
Before leaving, pay attention to the bottom of the page:
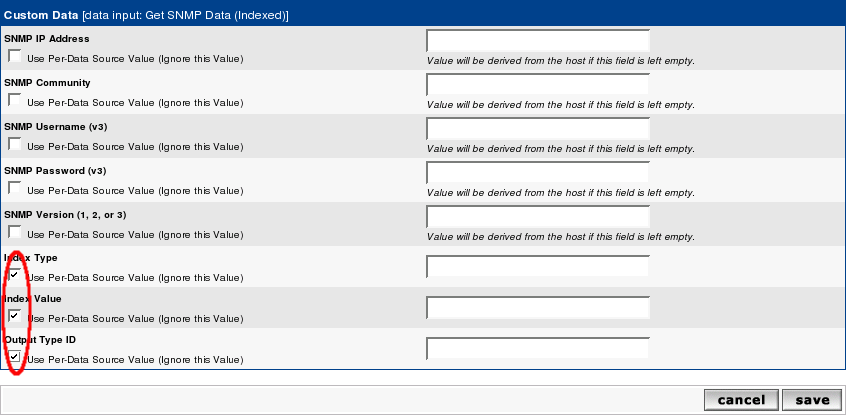
This is specific to indexed SNMP Queries. You will have to check the last
three items to make indexing work. All other items should be left alone, there values will be taken from the appropriate device definitions. Now Save and you're done with this step.
Create a Graph Template to tell cacti how to present the data
Now you want to tell cacti, how to present the data retrieved from SNMP Query. Again, this is done by merely copying the procedure described above. When selecting the Data Source, pay attention to select from the just defined data sources.
The next step is new and applies only to Data Queries:
Add Graph Template to the Data Query
Now it's time to re-visit our Data Query. Remember the Associated Graph Template we've left alone in the very first step? Now it will get a meaning. Go to Data Queries and select our new one. Then Add a new Associated Graph Template:

Give it a Name and select the generated Graph Template. Create.
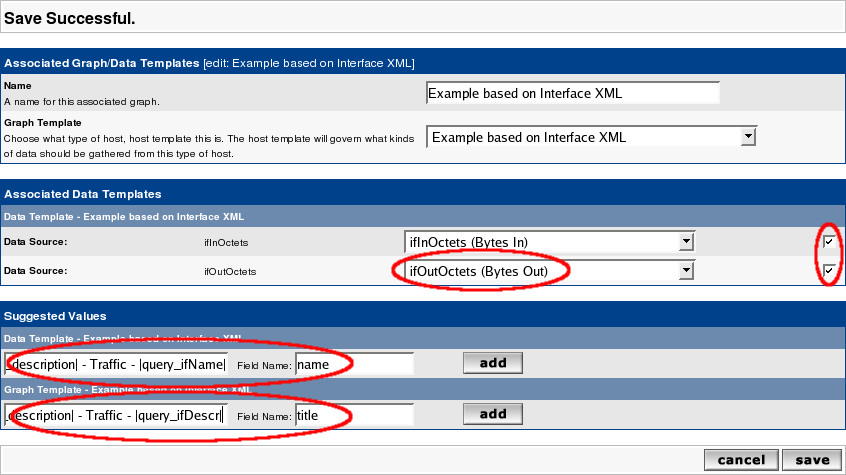
Select the correct Data Source, pay attention to checking the checkboxes of each row. Apply a name to the Data Template and a title to the Graph Template. Use cacti variables as defined in [url=http://www.cacti.net/downloads/docs/htm ... S">Chapter
15. Variables - Data Query Fields[/url]. You may use all XML fields defined as <direction>input</direction>; in this example the fields <ifName> and <ifDescr> of the
interface.xml were used. Add those Suggested Values. They will be used to distinguish Data Sources and Graphs for the same device; without this they all would carry the same name. At last: Save:

Apply the Data Query to your Device
Now go to your Device to add the Associated Data Query:

Click Add and then Create Graphs for this Host to see:

Now select the wanted interface and Create to generate the Traffic Graph. As long as there's only one Associated Graph Template for that Data Query, here will be now Select a Graph Type DropDown.
Summing up
To be more precise, cacti's tasks sum up as following:

You'll notice the association of Graph Templates to the Data Query as a last step. And a new theme has popped up, the Host Template. This one is for grouping Graph Templates and Data Queries with Associated Graph Templates together as a single Host Template. You may associate each Host to one of those Host Templates. This will ease the burden of associating endless lists of Graph Templates to dozens of hosts.
I appreciate any feedback to improve this document. You may find this as a PDF here
Reinhard