CPU usage on 2, 4 and 8 way Linux devices
Moderators: Developers, Moderators
with IOWAIT
Would someone be so kind to post the XML for multiple CPU + IOWAIT usage?
8 way processor
When I try to load the 8way xml into cacti-0.8.6i-1 I get the Error: XML parse error.
UCD-SNMP-MIB::versionTag.0 = STRING: 5.1.2
is there way to modify it to work?
UCD-SNMP-MIB::versionTag.0 = STRING: 5.1.2
is there way to modify it to work?
Cannot import 2-way template
I am using CACTI 0.8.6i and I get an "Error: XML parse error" trying to import the 2-way template. Please help!
Thanks,
Thanks,
cpu usage graph
this is my debug output. why do you think for some system, it is generating the correct graph and for some it is not. For example for several systems, cpu idle time is always 0. Eventhough the server is 90% idle. Do you think, there is a problem on the server side? I am using the same graph template for all devices since they are linux and running net snmp.
Please help, I stuck
usr/bin/rrdtool graph - \
--imgformat=PNG \
--start=1192573330 \
--end=1192659730 \
--title="sbkj2kappp02 - CPU Usage" \
--rigid \
--base=1000 \
--height=120 \
--width=500 \
--alt-autoscale-max \
--lower-limit=0 \
COMMENT:"From 2007/10/16 18\:22\:10 To 2007/10/17 18\:22\:10\c" \
COMMENT:" \n" \
--vertical-label="cpu ticks" \
--slope-mode \
DEF:a="/var/www/html/cacti/rra/_ucd_sscpurawsystem_845.rrd":ucd_ssCpuRawSystem:AVERAGE \
DEF:b="/var/www/html/cacti/rra/_ucd_sscpurawnice_844.rrd":ucd_ssCpuRawNice:AVERAGE \
DEF:c="/var/www/html/cacti/rra/_ucd_sscpurawuser_846.rrd":ucd_ssCpuRawUser:AVERAGE \
DEF:d="/var/www/html/cacti/rra/_ucd_sscpurawidle_843.rrd":ucd_ssCpuRawIdle:AVERAGE \
CDEF:cdefa=a,100,*,TIME,1192659072,GT,a,a,UN,0,a,IF,IF,TIME,1192659072,GT,b,b,UN,0,b,IF,IF,TIME,1192659072,GT,c,c,UN,0,c,IF,IF,TIME,1192659072,GT,d,d,UN,0,d,IF,IF,+,+,+,/ \
CDEF:cdeff=b,100,*,TIME,1192659072,GT,a,a,UN,0,a,IF,IF,TIME,1192659072,GT,b,b,UN,0,b,IF,IF,TIME,1192659072,GT,c,c,UN,0,c,IF,IF,TIME,1192659072,GT,d,d,UN,0,d,IF,IF,+,+,+,/ \
CDEF:cdefba=c,100,*,TIME,1192659072,GT,a,a,UN,0,a,IF,IF,TIME,1192659072,GT,b,b,UN,0,b,IF,IF,TIME,1192659072,GT,c,c,UN,0,c,IF,IF,TIME,1192659072,GT,d,d,UN,0,d,IF,IF,+,+,+,/ \
CDEF:cdefbf=d,100,*,TIME,1192659072,GT,a,a,UN,0,a,IF,IF,TIME,1192659072,GT,b,b,UN,0,b,IF,IF,TIME,1192659072,GT,c,c,UN,0,c,IF,IF,TIME,1192659072,GT,d,d,UN,0,d,IF,IF,+,+,+,/ \
AREA:cdefa#FF0000:"System" \
GPRINT:cdefa:LAST:"Current\:%8.2lf %s" \
GPRINT:cdefa:AVERAGE:"Avg\:%8.2lf %s" \
GPRINT:cdefa:MIN:"Min\:%8.2lf %s" \
GPRINT:cdefa:MAX:"Max\:%8.2lf %s\n" \
AREA:cdeff#00FF00:"Nice":STACK \
GPRINT:cdeff:LAST:" Current\:%8.2lf %s" \
GPRINT:cdeff:AVERAGE:"Avg\:%8.2lf %s" \
GPRINT:cdeff:MIN:"Min\:%8.2lf %s" \
GPRINT:cdeff:MAX:"Max\:%8.2lf %s\n" \
AREA:cdefba#0000FF:"User":STACK \
GPRINT:cdefba:LAST:" Current\:%8.2lf %s" \
GPRINT:cdefba:AVERAGE:"Avg\:%8.2lf %s" \
GPRINT:cdefba:MIN:"Min\:%8.2lf %s" \
GPRINT:cdefba:MAX:"Max\:%8.2lf %s\n" \
AREA:cdefbf#C0C0C0:"Idle":STACK \
GPRINT:cdefbf:LAST:" Current\:%8.2lf %s" \
GPRINT:cdefbf:AVERAGE:"Avg\:%8.2lf %s" \
GPRINT:cdefbf:MIN:"Min\:%8.2lf %s" \
GPRINT:cdefbf:MAX:"Max\:%8.2lf %s"
Hey fmangeant,
Yours xml templates causes update in cpu/nice/user original. can this do servers with single processor? If not, can update yours xml??
I update this xmls templates to not update the ucd/net cpu (original), just create ucd/net cpu (xx way) in "data template"
Yours xml templates causes update in cpu/nice/user original. can this do servers with single processor? If not, can update yours xml??
I update this xmls templates to not update the ucd/net cpu (original), just create ucd/net cpu (xx way) in "data template"
- Attachments
-
- cacti_graph_template_ucdnet_cpu_usage_2_way_561.xml
- Update xml to create new data template: ucd/net - CPU Usage - System (2 way)
ucd/net - CPU Usage - Nice (2 way)
ucd/net - CPU Usage - User (2 way) - (21.63 KiB) Downloaded 1169 times
-
- cacti_graph_template_ucdnet_cpu_usage_4_way_486.xml
- Update xml to create new data template: ucd/net - CPU Usage - System (4 way)
ucd/net - CPU Usage - Nice (4 way)
ucd/net - CPU Usage - User (4 way) - (21.63 KiB) Downloaded 1340 times
-
- cacti_graph_template_ucdnet_cpu_usage_8_way_188.xml
- Update xml to create new data template: ucd/net - CPU Usage - System (8 way)
ucd/net - CPU Usage - Nice (8 way)
ucd/net - CPU Usage - User (8 way) - (23.15 KiB) Downloaded 1293 times
I had these graphs in use for a long time, but decided to move back to a "traditional" cpu usage graph. This is not because these don't work (they work well for me), but rather because I was becoming blind to problems. I don't really have any systems that are not 4-way smp, many 8-way. However a lot of the servers might be running applications that don't scale very well. So looking through the graphs I will see 25-35% cpu usage and think everything is fine, when in reality the server is maxxed out due to processes not scaling over cpu's.
This is not meant to say the graph is pointless, it works great on servers which run applications that scale well over several cpu's. Just take this into consideration if you maintain a large amount of servers all running very different applications and you don't have a clear picture of what software is being run.
This is not meant to say the graph is pointless, it works great on servers which run applications that scale well over several cpu's. Just take this into consideration if you maintain a large amount of servers all running very different applications and you don't have a clear picture of what software is being run.
For some reason IO-Wait was vanishing when it went over ~20%, so on the long run it did not work very well (whenever there was a lot of IO-Wait it seemed there was none...).kormoc wrote:Would you be so kind to upload what you did to add IO wait?kamina wrote:I finally managed to get io-wait which was consistant enough to judge from the averige, it definatly does need to be divided.
Thanks!
But the basic idea is to do exacly the same as is being done for the cpu-usage. Divide the value you receive by the amount of cpu's.
ello
I've managed to import xmls for 2 cpus but i get nothing or only avereg = 1 . i've checked that no data source is create:
can anybody help?
I've managed to import xmls for 2 cpus but i get nothing or only avereg = 1 . i've checked that no data source is create:
Code: Select all
RRDTool Says:

ERROR: opening '/usr/share/cacti/site/rra/luger_2_cpu_93.rrd': No such file or directoryThere is another thread about this...
http://forums.cacti.net/about11615-0-asc-0.html
Anyone working those with 0.8.7b?
fmangeant, could you make some templates like that? and I need a template for 16 CPUs.
Such a newbie I am
Anyone working those with 0.8.7b?
fmangeant, could you make some templates like that? and I need a template for 16 CPUs.
Such a newbie I am
-
victormilk2002
- Posts: 8
- Joined: Sun Mar 16, 2008 9:20 pm
Hi all,
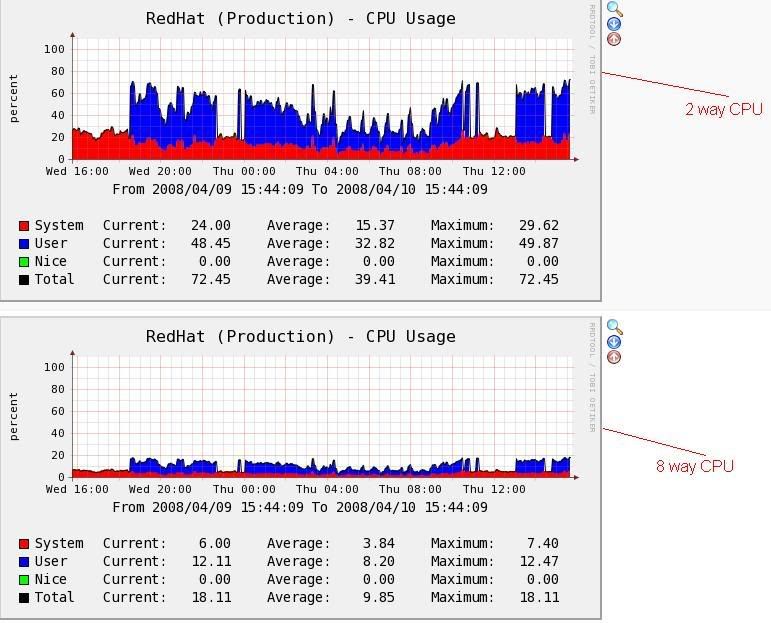
As you can see the pictures below, I imported two templates to cacti. One was 2 way CPU graph, another one was 8 way CPU graph. 8 way CPU graph represents the actual usage of the CPU. You can see the blue graph was not continuous, some users data were lost.

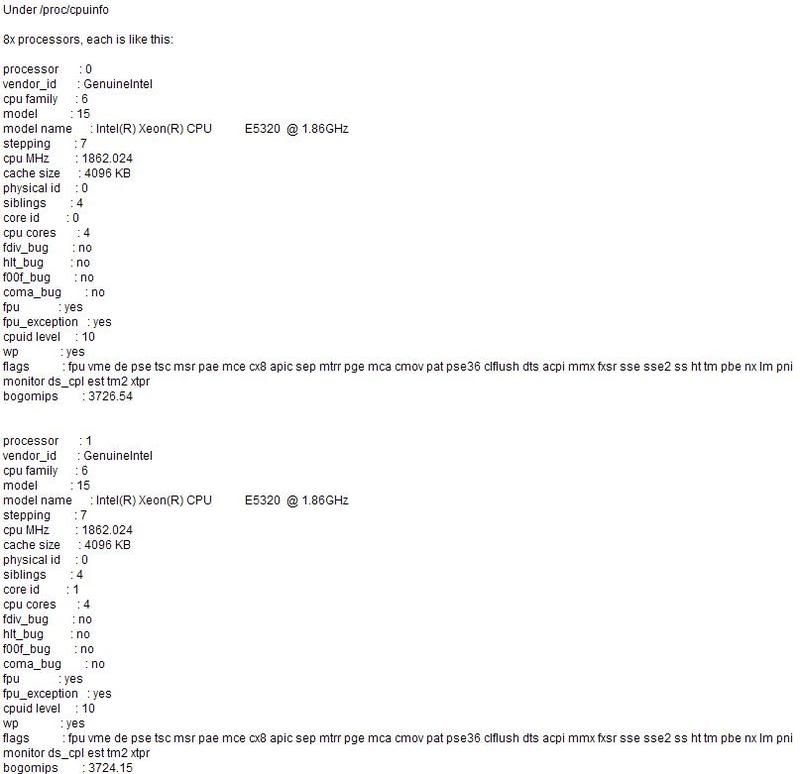
The CPU details are as follows:

Can somebody help me explain why the graph is not continuous?
As you can see the pictures below, I imported two templates to cacti. One was 2 way CPU graph, another one was 8 way CPU graph. 8 way CPU graph represents the actual usage of the CPU. You can see the blue graph was not continuous, some users data were lost.

The CPU details are as follows:

Can somebody help me explain why the graph is not continuous?
-
plotting4fun
- Posts: 24
- Joined: Thu Dec 11, 2008 10:42 am
-
plotting4fun
- Posts: 24
- Joined: Thu Dec 11, 2008 10:42 am
I've fixed the problem by executing this in the rra directory, unfortunately I need to execute it every time that I add this graph template to a host.
for file in *cpu_nice*.rrd ; do echo $file start ; rrdtool tune $file --maximum cpu_nice:800 ; echo $file end ; done
for file in *cpu_user*.rrd ; do echo $file start ; rrdtool tune $file --maximum cpu_user:800 ; echo $file end ; done
for file in *cpu_system*.rrd ; do echo $file start ; rrdtool tune $file --maximum cpu_system:800 ; echo $file end ; done
-
Mickelebof
- Posts: 7
- Joined: Sat May 30, 2009 12:07 pm
Hi,
I have a problem and I don't understand why.
I've remplaced CPU nice by CPU idle, so it does'nt work for one server only (Quad Core).

Cpuinfo : model name : Intel(R) Xeon(R) CPU X3360 @ 2.83GHz
No errors in logs, the value is correct :
05/30/2009 07:10:06 PM - CMDPHP: Poller[0] Host[10] DS[226] SNMP: v1: 94.23.xx.xxx, dsname: cpu_idle, oid: .1.3.6.1.4.1.2021.11.53.0, output: 658085696
I have an another server Quad Core, but this one works perfectly :

Cpuinfo : model name : Intel(R) Core(TM)2 Quad CPU @ 2.40GHz
I don't understand why the value stay to 0,0 because SNMP output il correctly received.
Thanks for your help (and sorry for my bad english)
Edit : I have a third server Quad Core with the same processor :
Cpuinfo : model name : Intel(R) Xeon(R) CPU X3360 @ 2.83GHz
This server is exactly the same as the first, and the graph works perfectly
I have a problem and I don't understand why.
I've remplaced CPU nice by CPU idle, so it does'nt work for one server only (Quad Core).

Cpuinfo : model name : Intel(R) Xeon(R) CPU X3360 @ 2.83GHz
No errors in logs, the value is correct :
05/30/2009 07:10:06 PM - CMDPHP: Poller[0] Host[10] DS[226] SNMP: v1: 94.23.xx.xxx, dsname: cpu_idle, oid: .1.3.6.1.4.1.2021.11.53.0, output: 658085696
I have an another server Quad Core, but this one works perfectly :

Cpuinfo : model name : Intel(R) Core(TM)2 Quad CPU @ 2.40GHz
I don't understand why the value stay to 0,0 because SNMP output il correctly received.
Thanks for your help (and sorry for my bad english)
Edit : I have a third server Quad Core with the same processor :
Cpuinfo : model name : Intel(R) Xeon(R) CPU X3360 @ 2.83GHz
This server is exactly the same as the first, and the graph works perfectly
Who is online
Users browsing this forum: No registered users and 1 guest