[Solved] Graph output

Post support questions that relate to the Windows 2003/2000/XP operating systems.

Moderators: Developers, Moderators

hboogz
Posts: 28
Joined: Wed Apr 16, 2008 11:10 am

[Solved] Graph output

Post by hboogz »

Everyone,

i just installed cacti 2 days ago and am learning as i go.

I'm running on a windows xp box with

Cacti 0.87b
spine 0.87a
PA 2.1
Mysql 5.x
PHP 5.x
IIS

I am monitoring a 3com 4500 switch. After a few days of troubleshooting getting maps to populate wtih data, installing the troublesome PA 2.1, i think it's up, but am seeing a couple of issues that i don't know how to address.
  • Are there additions to Data Types that can be added instead of just In/Out Bits, etc ?

    I also want to be able to monitor the type of traffic coming/going from each interface and determine how much bandwidth each interface is consuming.

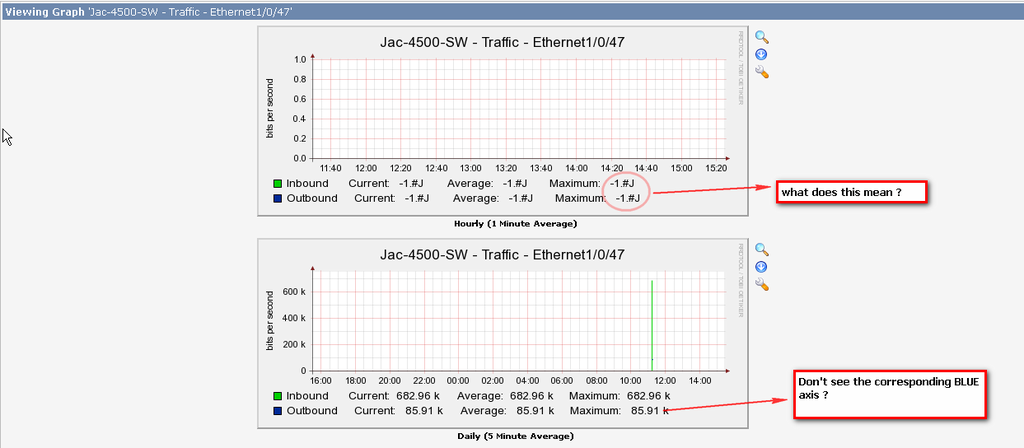
    Right, now i have IN/Out Bits, but all the graph seems to populate is Incoming. I do see numbers populated for outgoing, but don't see a correspong BLUE axis on the graph ?

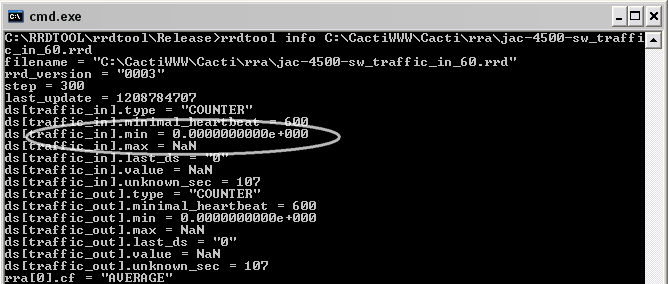
    I noticed that the status of the device is DOWN but it's pingable..
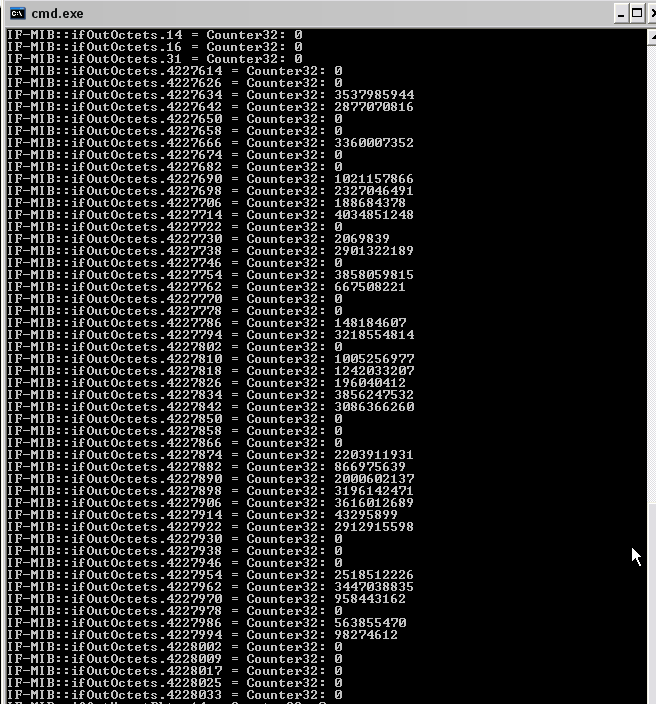
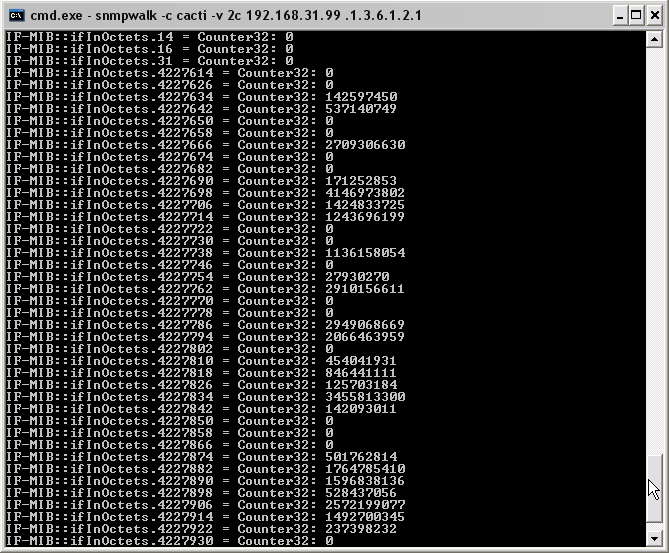
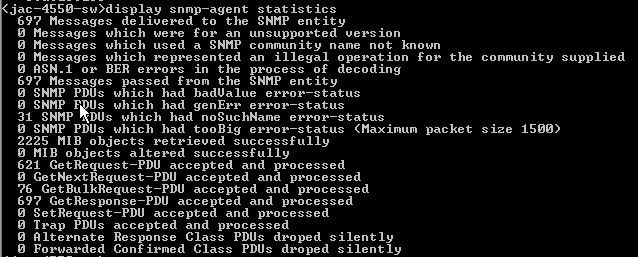
At the bottom of the post, i'll attach some screenshots of areas of concern. Hoping someone could help me out.

3com SNMP stats..
Image

Graph Stats..

Image
User avatar
gandalf
Developer
Posts: 22383
Joined: Thu Dec 02, 2004 2:46 am
Location: Muenster, Germany
Contact:

Post by gandalf »

Moving to Windows. Please search for posts of BSOD2600. He has published a good windows manual.
Reinhard
User avatar
BSOD2600
Cacti Moderator
Posts: 12171
Joined: Sat May 08, 2004 12:44 pm
Location: USA

Post by BSOD2600 »

1) graph 1. -1#J just means a lack of data for rrdtool. It doesn't have anything to graph.

2) Actually, there is a tiny blue line in that green spike. Looks like something isn't configured properly with the device and cacti thinks its down, or the interface index has changed. Follow http://forums.cacti.net/viewtopic.php?t=11747 for more info.
hboogz
Posts: 28
Joined: Wed Apr 16, 2008 11:10 am

Post by hboogz »

Thanks, I followed BSOD's guide pretty accurately, i believe.

how could one graph populate data while the other not ?

How can i verify that the switch is in fact sending data to cacti ? I've never really configured snmp on a 3com switch, but i'm assuming it's turned on and there isn't much more config necessary with regards to SNMP v1 and v2c..

I'm trying to attach my debug log, but keep getting a MISTAKE page..
User avatar
BSOD2600
Cacti Moderator
Posts: 12171
Joined: Sat May 08, 2004 12:44 pm
Location: USA

Post by BSOD2600 »

Try zipping up your cacti.log. We only need one polling cycle with debugging logging enabled.

As for the no graphs, did you follow http://docs.cacti.net/node/283 yet?
hboogz
Posts: 28
Joined: Wed Apr 16, 2008 11:10 am

Post by hboogz »

Here goes with the zip attachment.

I haven't started looking at that because i'm really not sure which of the troubleshooting steps are geared for a windows installation.
Attachments
cacti.zip
(32.79 KiB) Downloaded 167 times
User avatar
BSOD2600
Cacti Moderator
Posts: 12171
Joined: Sat May 08, 2004 12:44 pm
Location: USA

Post by BSOD2600 »

Alright, well your problems all stem from the same issues. So lets consolidate this into one thread instead of 3 duplicates.

I see you have the plugin arch installed too. It's possible plugins can be mucking with stuff too.

Go ahead and follow that guide I linked to anyways, substituting linux stuff for relevant Windows commands. You basically need to
1) verify cacti is getting data from the device (debugging logging)
2) verify the rrd files are getting updated (Rrdtool fetch)
3) verify you don't have any permission problems.
hboogz
Posts: 28
Joined: Wed Apr 16, 2008 11:10 am

Post by hboogz »

1) verify cacti is getting data from the device (debugging logging)
Not sure how to get that done ?
verify the rrd files are getting updated (Rrdtool fetch)
is there a syntax i could use to get some results ?

I really doubt i have permissions problems on the box i'm using, since it's my own personal workstation at work and i'm an admin on every folder on here, but it's windows. But based on the permissions checklist in your document, all those folders were given the right permissions.

As far as the NET-SNMP post, i really don't know where the problem is.. ?
User avatar
BSOD2600
Cacti Moderator
Posts: 12171
Joined: Sat May 08, 2004 12:44 pm
Location: USA

Post by BSOD2600 »

hboogz wrote:
1) verify cacti is getting data from the device (debugging logging)
Not sure how to get that done ?
This is documented in the README post and graph debugging posts which I've linked you to already...

Turn the polling level in cacti to debug (Settings | Polling level) for one cycle, wait for Cacti to run, and paste the output of the actual log file (<webroot>/cacti/log/cacti.log). If it contains WEBLOG entries, then don't bother posting since they just clutter up the log. Turn off WEBEVENTS logging and try again.
hboogz wrote:
verify the rrd files are getting updated (Rrdtool fetch)
is there a syntax i could use to get some results ?
Once again, in the graph debugging post, this is all covered. Please re-read it.
hboogz wrote:I really doubt i have permissions problems on the box i'm using, since it's my own personal workstation at work and i'm an admin on every folder on here, but it's windows. But based on the permissions checklist in your document, all those folders were given the right permissions
While you might run everything as admin, IIS does not. Thus, permissions need to be specially set up for stuff to function properly. Furthermore, you do NOT want a web server running with admin rights on a PC!
hboogz
Posts: 28
Joined: Wed Apr 16, 2008 11:10 am

Post by hboogz »

Thansk BSOD so far for all your input. I'm still not getting any data on my graphs, but will re-read all your posts.

As requested, attached is a DEBUG log from cacti.

I ran procmon using your NTFS permissions guide and didn't find any "denied" strings.

going to delve into the rrdtool syntax now..
Attachments
cacti04222008.zip
(41.47 KiB) Downloaded 306 times
hboogz
Posts: 28
Joined: Wed Apr 16, 2008 11:10 am

Post by hboogz »

while following the debug NAN post, i come up with the following issues.

while running this:
rrdtool update <filename> --template ...
I get this:
C:\RRDTOOL\rrdtool\Release>rrdtool update C:\CactiWWW\Cacti\rra\jac-4500-sw_traf
fic_in_60.rrd --template
ERROR: unknown option '--template'

C:\RRDTOOL\rrdtool\Release>rrdtool update C:\CactiWWW\Cacti\rra\jac-4500-sw_traf
fic_in_60.rrd --template ...
ERROR: Not enough arguments

In the step that indicates to check the cacti poller, my DEBUG log doesn't really tell me anything that i can understand. I've attached a debug log for once cycle.

I guess one good point is when i run an snmpget, i get the following result:
C:\RRDTOOL\rrdtool\Release>snmpget -c cacti -v 2c 192.168.31.99 .1.3.6.1.2.1.2.2
.1.16.4228002
IF-MIB::ifOutOctets.4228002 = Counter32: 0
When i run a rrdtool info against a file, i notice the infamous NaN values.

Image

honestly, not sure what to do from here ? read through the entire debug nan post, but maybe i'm missing a step..
Attachments
cactidebug.txt
(128.3 KiB) Downloaded 148 times
User avatar
BSOD2600
Cacti Moderator
Posts: 12171
Joined: Sat May 08, 2004 12:44 pm
Location: USA

Post by BSOD2600 »

1) you still have your plugins enabled. Disable them ALL, until you get your cacti install sorted out.

2) when posting your cacti log file, we only want a SINGLE polling session with debugging info. Not weeks worth. Currently, your cacti install seems to be failing because of the weather (and possibly other) plugins.

3) The "rrdtool update <filename> --template ..." bit from the guide is for you to manually run that, which you [would see] in your cacti log file with debugging enabled. You currently do not have that.

4) That snmpwalk of the interface shows it doesn't report any traffic. Try snmpwalk on .1.3.6.1.2.1 instead. If all the interfaces report 0 for the ifIn/Out octets, your device doesnt report traffic data.

5) The NaN for the ds MAX is ok, just means rrdtool will accept any number. It's the DS.value field which is NaN, which you should be concerned about.
hboogz
Posts: 28
Joined: Wed Apr 16, 2008 11:10 am

Post by hboogz »

disabled all my plugins

i've attached a single cycled debug log, doesn't look helpful but hopefully it is

snmpwalk outputted a lot of data, but i believe i got what was needed..

if-out

Image

If-in

Image
Attachments
cactidebug3.zip
(4.16 KiB) Downloaded 120 times
User avatar
BSOD2600
Cacti Moderator
Posts: 12171
Joined: Sat May 08, 2004 12:44 pm
Location: USA

Post by BSOD2600 »

Alright, your device reports interface data.

1) change the poller back to cmd.php. Spine can create additional issues.

2) change the cacti logging level to low. click save. change it back to debug, click save. When the cacti poller runs, you should see it checking for device up/down status, snmp polling, rrdtool updating, etc. None of this is found in yours.

3) How did you disable the plugins? Uncomment them from config.php?
hboogz
Posts: 28
Joined: Wed Apr 16, 2008 11:10 am

Post by hboogz »

is there anyone else besides BSOD who can offer some assistance on this ?

i'm sure some of you are wondering how could i be running into so much problems, because i'm wondering the same exact thing.


I'm really at a standstill and i have to figure out what's happening on this host(switch) because management has reported an increase of bandwidth usage and wants it documented ASAP.
Post Reply

Who is online

Users browsing this forum: No registered users and 2 guests