Ad blocker detected: Our website is made possible by displaying online advertisements to our visitors. Please consider supporting us by disabling your ad blocker on our website.
I have a question regarding the interpretation of a Linux server's CPU usage graph.
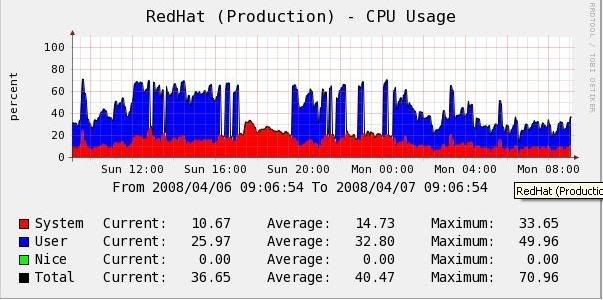
As you can see in the graph below, the blue (representing user) suddenly dropped at 5pm and rose sharply at 7pm. It was quite strange, as it was the peak of user usage during that time.
Hence, I was wondering why the blue graph was not continuous (And also the reliability of the graph explanation, as it may not reflect the true side of the CPU usage.)
Thank you very much and please help me solve the problem.
I suppose the user value exceeds 100 while the data template's data source MAX is set to 100. See second link of my sig for more details. Search for MAXIMUM
Reinhard
First of all, thank you for your reply. But, I do not agree with you that the CPU graph was discontinuous because of the CPU value reaching to the maximum value (100%).
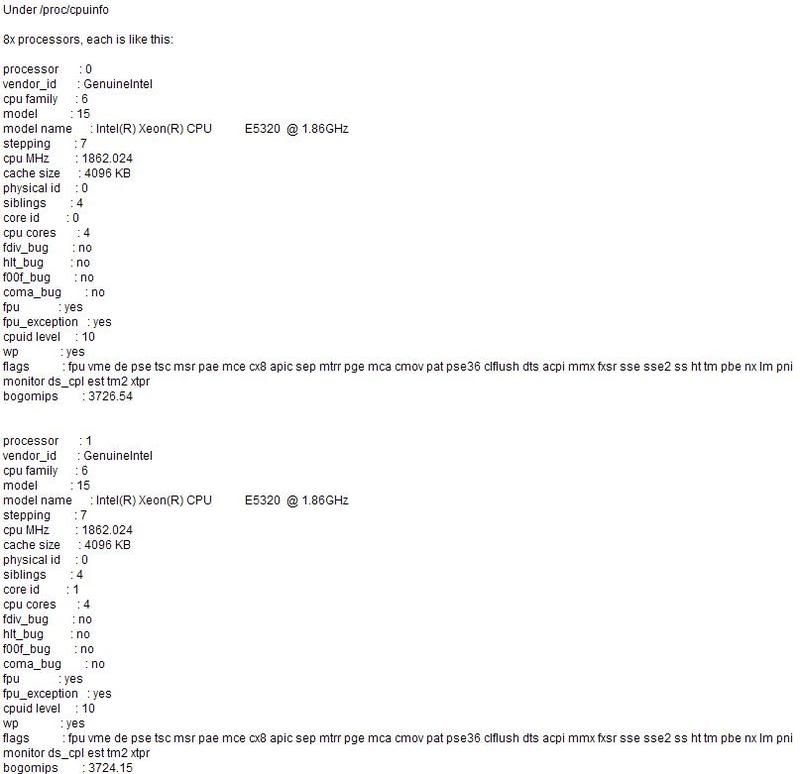
Let me explain the situation to you. It is a Redhat server with 8 CPUs. The info details are as follows:
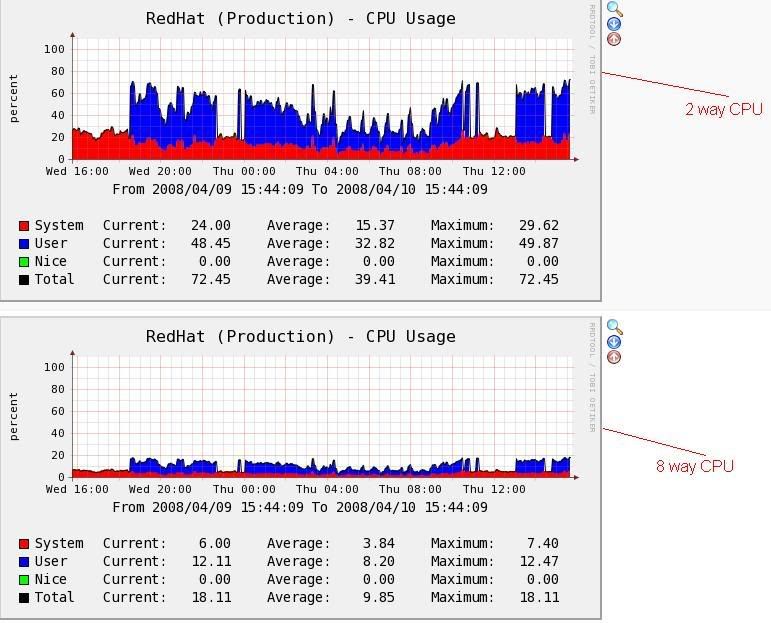
As you can see the pictures below as well, I imported two templates to cacti. One was 2 way CPU graph, another one was 8 way CPU graph. 8 way CPU graph represents the actual usage of the CPU. You can see the blue graph was not continuous, some users data were lost. But the CPU usage was just around 20%. It was still a long way to reach 100%.
These old templates need updating. The max for a 4 CPU system woudl be allmost 400 since the measurements are not taken at the same time. For a 2 CPU system, it would be 200.
TheWitness
True understanding begins only when we realize how little we truly understand...