Ad blocker detected: Our website is made possible by displaying online advertisements to our visitors. Please consider supporting us by disabling your ad blocker on our website.
To use, unzip the template, import xml files and place appropriates files in scripts and ressources.
Not all of the 65535 ports will be tested (too long i think...), so you must edit file ports.inc.
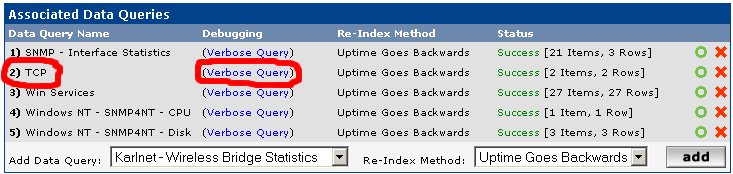
Then go to Associated Data Queries, add TCP, click verbose and go to graphs.
This is derivate from my Plugin Manage and Cacti users without Plugin Architecture can use it.
i'm currently teting your cool plugin, but i have a problem
ive installed your manage plugin. everything seems to work. When i bring down a tcp port the manage tool detects that. But when i display the graph, it is always down.
when i look at my poller log i see that it returns the U value.
i've installed this when the zip was updates for version 0.8.7, but i run 0.8.6j. I think this could be the problem.
Data Query Debug Information

+ Running data query [12].
+ Found type = '6 '[script query].
+ Found data query XML file at 'C:/Inetpub/wwwroot/cacti/resource/script_server/tcp.xml'
+ XML file parsed ok.
+ Executing script for list of indexes 'c:\php\php.exe -q C:\Inetpub\wwwroot\cacti\scripts\tcp.php localhost 2 index'
+ Executing script query 'c:\php\php.exe -q C:\Inetpub\wwwroot\cacti\scripts\tcp.php localhost 2 query index'
+ Found data query XML file at 'C:/Inetpub/wwwroot/cacti/resource/script_server/tcp.xml'
+ Found data query XML file at 'C:/Inetpub/wwwroot/cacti/resource/script_server/tcp.xml'
+ Found data query XML file at 'C:/Inetpub/wwwroot/cacti/resource/script_server/tcp.xml'
+ Found data query XML file at 'C:/Inetpub/wwwroot/cacti/resource/script_server/tcp.xml'
Data Query [TCP]

This data query returned 0 rows, perhaps there was a problem executing this data query. You can run this data query in debug mode to get more information.
To use, unzip the template, import xml files and place appropriates files in scripts and ressources.
Not all of the 65535 ports will be tested (too long i think...), so you must edit file ports.inc.
Then go to Associated Data Queries, add TCP, click verbose and go to graphs.
This is derivate from my Plugin Manage and Cacti users without Plugin Architecture can use it.
I installed this and all my queries in debug mode show no errors, however the graph never displays here is the error I get in my /var/log/httpd/error_log:
the RRD does not contain an RRA matching the chosen CF
+ Running data query [16].
+ Found type = '6 '[script query].
+ Found data query XML file at 'D:/Web/Cacti/resource/script_server/tcp.xml'
+ XML file parsed ok.
+ Executing script for list of indexes 'D:\Web\PHP5\php.exe -q D:\Web\Cacti\scripts\tcp.php 172.17.170.8 53 index'
+ Executing script query 'D:\Web\PHP5\php.exe -q D:\Web\Cacti\scripts\tcp.php 172.17.170.8 53 query index'
+ Found item [ServiceIndex='80'] index: 80
+ Found item [ServiceIndex='443'] index: 443
+ Found item [ServiceIndex='110'] index: 110
+ Found item [ServiceIndex='995'] index: 995
+ Found item [ServiceIndex='25'] index: 25
+ Found item [ServiceIndex='143'] index: 143
+ Found item [ServiceIndex='993'] index: 993
+ Found data query XML file at 'D:/Web/Cacti/resource/script_server/tcp.xml'
+ Found data query XML file at 'D:/Web/Cacti/resource/script_server/tcp.xml'
+ Found data query XML file at 'D:/Web/Cacti/resource/script_server/tcp.xml'
+ Found data query XML file at 'D:/Web/Cacti/resource/script_server/tcp.xml'
+ Found data query XML file at 'D:/Web/Cacti/resource/script_server/tcp.xml'
+ Found data query XML file at 'D:/Web/Cacti/resource/script_server/tcp.xml'
+ Found data query XML file at 'D:/Web/Cacti/resource/script_server/tcp.xml'
+ Found data query XML file at 'D:/Web/Cacti/resource/script_server/tcp.xml'
+ Found data query XML file at 'D:/Web/Cacti/resource/script_server/tcp.xml'
+ Found data query XML file at 'D:/Web/Cacti/resource/script_server/tcp.xml'
In the graph tabs, there is no graph for "|host_description| -TCP -".
In the cacti Console -> Graph Management , I turn on debug mod and I have the result in the first attachment.
In the Cacti Console -> Data Sources I turn on debug mode and have the result in second attachment.
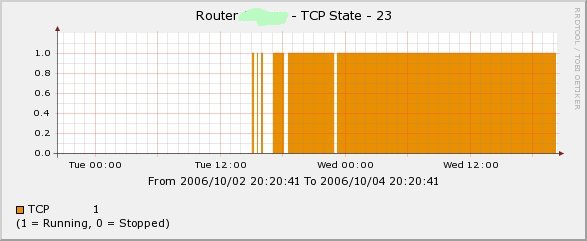
The poller run properly and return correct value : 1 for port status.
In the cacti log file have this errors :
07/30/2008 05:30:21 PM - CMDPHP: Poller[0] ERROR: There are no RRA's assigned to local_data_id: 1224.
07/30/2008 05:30:20 PM - CMDPHP: Poller[0] ERROR: There are no RRA's assigned to local_data_id: 1218.
07/30/2008 05:30:20 PM - CMDPHP: Poller[0] ERROR: There are no RRA's assigned to local_data_id: 1219.
07/30/2008 05:30:20 PM - CMDPHP: Poller[0] ERROR: There are no RRA's assigned to local_data_id: 1222.
07/30/2008 05:30:20 PM - CMDPHP: Poller[0] ERROR: There are no RRA's assigned to local_data_id: 1223.
07/30/2008 05:30:20 PM - CMDPHP: Poller[0] ERROR: There are no RRA's assigned to local_data_id: 1221.
07/30/2008 05:30:20 PM - CMDPHP: Poller[0] ERROR: There are no RRA's assigned to local_data_id: 1220.
07/30/2008 05:30:16 PM - CMDPHP: Poller[0] ERROR: There are no RRA's assigned to local_data_id: 1212.
07/30/2008 05:30:14 PM - CMDPHP: Poller[0] ERROR: There are no RRA's assigned to local_data_id: 1242.
07/30/2008 05:30:10 PM - CMDPHP: Poller[0] ERROR: There are no RRA's assigned to local_data_id: 1257.
07/30/2008 05:30:10 PM - CMDPHP: Poller[0] ERROR: There are no RRA's assigned to local_data_id: 1259.
My cacti is 8.7.b with rrdtool 1.2.x (lastest version) and only graph for TCP template not working!!!
thanks for the templates.
Just to give some information on how i got them to work with the latest cactiEZ-distribution: i need to edit your tcp.php script, line 54 and 57 (print "0", print "1"). Instead of "printing" the retun values i "returned" them:
return "0", return "1".
I had all "NaN" before, poller output was "1U" instead of only "1" or "0".
I have a problem whith graph on TCP template for all my devices.
The snmp query is ok and return :
[quote]5) TCP (Verbose Query) Uptime Goes Backwards Success [7 Items, 7 Rows][/quote]
In verbose :
[quote]+ Running data query [16].
+ Found type = '6 '[script query].
+ Found data query XML file at 'D:/Web/Cacti/resource/script_server/tcp.xml'
+ XML file parsed ok.
+ Executing script for list of indexes 'D:\Web\PHP5\php.exe -q D:\Web\Cacti\scripts\tcp.php 172.17.170.8 53 index'
+ Executing script query 'D:\Web\PHP5\php.exe -q D:\Web\Cacti\scripts\tcp.php 172.17.170.8 53 query index'
+ Found item [ServiceIndex='80'] index: 80
+ Found item [ServiceIndex='443'] index: 443
+ Found item [ServiceIndex='110'] index: 110
+ Found item [ServiceIndex='995'] index: 995
+ Found item [ServiceIndex='25'] index: 25
+ Found item [ServiceIndex='143'] index: 143
+ Found item [ServiceIndex='993'] index: 993
+ Found data query XML file at 'D:/Web/Cacti/resource/script_server/tcp.xml'
+ Found data query XML file at 'D:/Web/Cacti/resource/script_server/tcp.xml'
+ Found data query XML file at 'D:/Web/Cacti/resource/script_server/tcp.xml'
+ Found data query XML file at 'D:/Web/Cacti/resource/script_server/tcp.xml'
+ Found data query XML file at 'D:/Web/Cacti/resource/script_server/tcp.xml'
+ Found data query XML file at 'D:/Web/Cacti/resource/script_server/tcp.xml'
+ Found data query XML file at 'D:/Web/Cacti/resource/script_server/tcp.xml'
+ Found data query XML file at 'D:/Web/Cacti/resource/script_server/tcp.xml'
+ Found data query XML file at 'D:/Web/Cacti/resource/script_server/tcp.xml'
+ Found data query XML file at 'D:/Web/Cacti/resource/script_server/tcp.xml'[/quote]
In the graph tabs, there is no graph for "|host_description| -TCP -".
In the cacti Console -> Graph Management , I turn on debug mod and I have the result in the first attachment.
In the Cacti Console -> Data Sources I turn on debug mode and have the result in second attachment.
The poller run properly and return correct value : 1 for port status.
In the cacti log file have this errors :
[quote]07/30/2008 05:30:21 PM - CMDPHP: Poller[0] ERROR: There are no RRA's assigned to local_data_id: 1224.
07/30/2008 05:30:20 PM - CMDPHP: Poller[0] ERROR: There are no RRA's assigned to local_data_id: 1218.
07/30/2008 05:30:20 PM - CMDPHP: Poller[0] ERROR: There are no RRA's assigned to local_data_id: 1219.
07/30/2008 05:30:20 PM - CMDPHP: Poller[0] ERROR: There are no RRA's assigned to local_data_id: 1222.
07/30/2008 05:30:20 PM - CMDPHP: Poller[0] ERROR: There are no RRA's assigned to local_data_id: 1223.
07/30/2008 05:30:20 PM - CMDPHP: Poller[0] ERROR: There are no RRA's assigned to local_data_id: 1221.
07/30/2008 05:30:20 PM - CMDPHP: Poller[0] ERROR: There are no RRA's assigned to local_data_id: 1220.
07/30/2008 05:30:16 PM - CMDPHP: Poller[0] ERROR: There are no RRA's assigned to local_data_id: 1212.
07/30/2008 05:30:14 PM - CMDPHP: Poller[0] ERROR: There are no RRA's assigned to local_data_id: 1242.
07/30/2008 05:30:10 PM - CMDPHP: Poller[0] ERROR: There are no RRA's assigned to local_data_id: 1257.
07/30/2008 05:30:10 PM - CMDPHP: Poller[0] ERROR: There are no RRA's assigned to local_data_id: 1259.[/quote]
My cacti is 8.7.b with rrdtool 1.2.x (lastest version) and only graph for TCP template not working!!!
Can you help me??? :roll:
Thanks[/quote]
I have EXACTLY the same problem...
cacti version - 0.8.7d
I noticed that my graphs for the TCP ports I am monitoring always show as down (ie a value of 0). Digging a little further I noticed that within the data template for TCP the "Maximum Value" was 0 (look under Console > Data templates - it's about half way down the page). I've changed that to 1 and now my TCP ports show as up.
I assume that was the right thing to do... if it is could someone please update the templates in the original source location?