Bandwidth as a percentage
Moderators: Developers, Moderators
-
scrapper777
- Posts: 5
- Joined: Mon Sep 24, 2007 9:21 am
Bandwidth as a percentage
Is there a way to change the interface traffic displayed for a switch port to show the bandwidth being used as a percentage? For example, the total in/out traffic of a port is 11Mb of a 100Mb port is 11% ?

Ok, attach is the picture that i have made some adjustment on the percentage utilization. Also i attach XML template for your usage. Do take note that the graph is a bit stretch, just to accommodate all the legend in 2 lines.

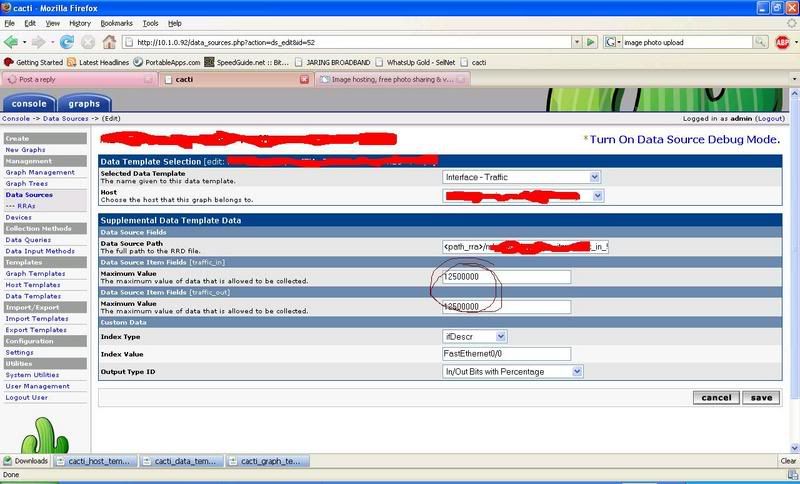
***PLEASE TAKE NOTE, AFTER APPLYING MY TEMPLATE, CHANGE YOUR "DATA SOURCE > DATA SOURCE ITEM FIELD" TO BYTES.


***PLEASE TAKE NOTE, AFTER APPLYING MY TEMPLATE, CHANGE YOUR "DATA SOURCE > DATA SOURCE ITEM FIELD" TO BYTES.

- Attachments
-
- template.zip
- (23.68 KiB) Downloaded 389 times
KeyBoarD Is MightieR ThaN ThE sWorD, iF onLy ConNecTed tO tHe InTernET..
Hi. I have problem to use this template. I get percents but wrong. Please help.
- Attachments
-
- Problem.doc
- Problem
- (136.5 KiB) Downloaded 198 times
hi,
i imported the xml file and got a new graph template.
i tried to use it on a graph that i had already running but the grapg turned to what can be seen in the picture attached.
it would be really nice to have the percent next to the bps legend.
i imported the xml file and got a new graph template.
i tried to use it on a graph that i had already running but the grapg turned to what can be seen in the picture attached.
it would be really nice to have the percent next to the bps legend.
- Attachments
-
- image1.jpg (67.72 KiB) Viewed 5919 times
seem to have solved the problem.
when applying this new grapgh template to a graph that already exist happens that the outbound datasource disapears and the inbound gets to be the outboud, like the picture shows.
it needs to be fixed and the datasource for that interface has to be adjusted to the bytes, this done it seems pretty ok.
i don't know why applying this new graph to ana existing one messes up things! any ideas?
- Attachments
-
- image2.jpg (178.45 KiB) Viewed 5918 times
sorry
Hello,
I think this script is the one i needed an it seems great.
I'm a newbie in Cacti and i can't manage to create a graph with this template.
I have a basic router wich has in/out stats (a Netgear FVX538), i added my router to cacti i have imported the templates.
I'm on the way to create a new graph, i've selected my host.
What do i have to do next?
Thanks
Error when running template
Hi , I imported the xml template into Cacti but I don't see a graph. I ran debug and everything is working except for the following:
RRD Tool Says:
ERROR: opening '/srv/cacti/rra/idf1_traffic_in_76.rrd': No such file or directory
Anyone know how this can be fixed? I tried to reimport the file and it still gives the same error.
RRD Tool Says:
ERROR: opening '/srv/cacti/rra/idf1_traffic_in_76.rrd': No such file or directory
Anyone know how this can be fixed? I tried to reimport the file and it still gives the same error.
Who is online
Users browsing this forum: No registered users and 5 guests